
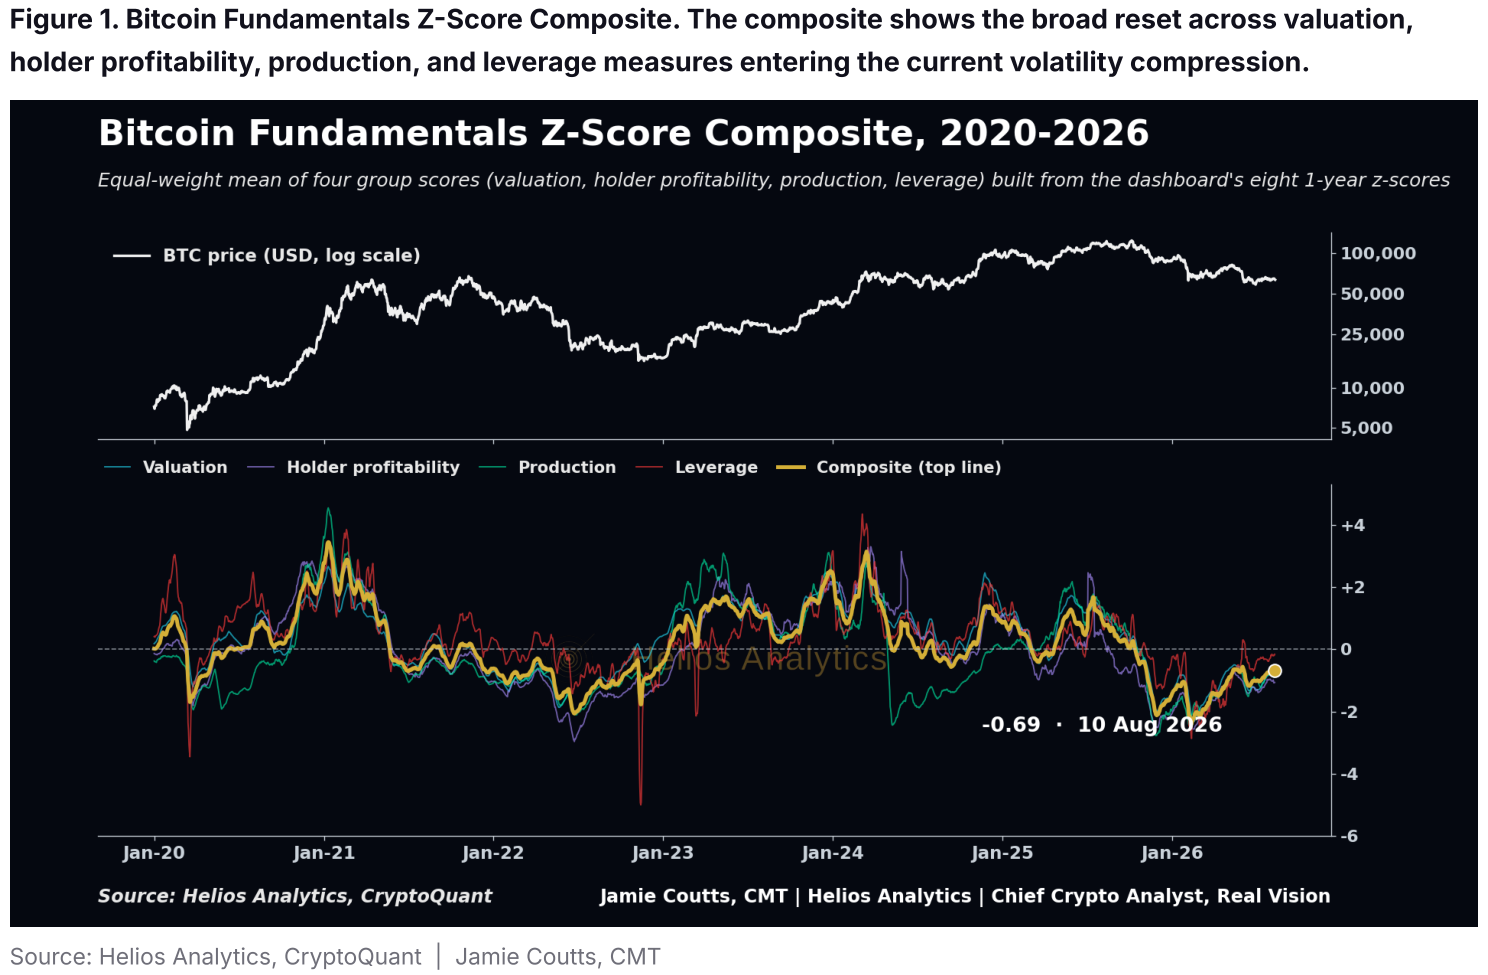
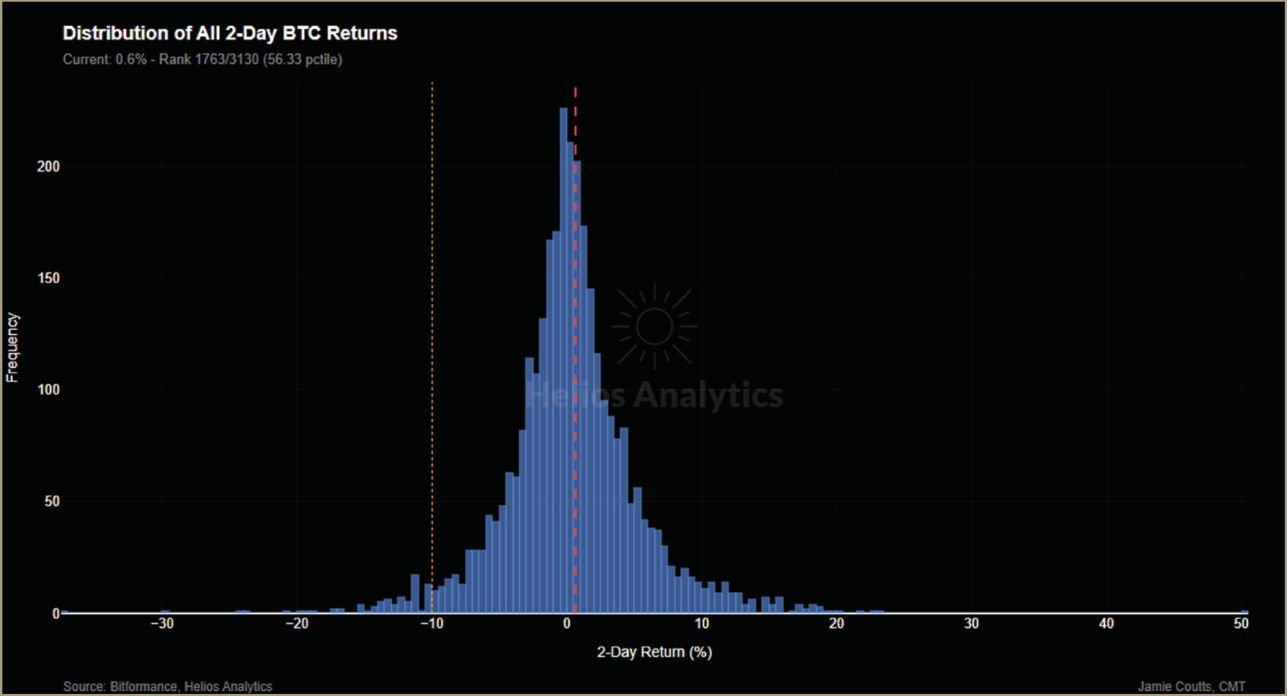
Bitcoin is known for its fat tails — nerd-speak for vicious moves to the downside and explosive moves to the upside. Last week was the former: a 3.5 sigma drawdown, one of the most violent selloffs in Bitcoin’s history.
Distribution of All 2-Day Bitcoin Returns since 2017
Dry Brush in the Forest
A few weeks ago, I listened to David Dredge on the WBD podcast. Dredge is a veteran volatility trader who has spent decades at the intersection of leverage, structured products, and systemic risk. One image stuck with me. He described Wall Street’s entry into Bitcoin as a buildup of dry brush in a forest. The leverage is hidden. The risk is uncapitalised. And when the fire comes, it is not a contained burn.
His argument is simple and, I think, correct. Bitcoin’s native volatility is transparent. When a leveraged trader on a crypto exchange runs out of margin, the position is extinguished immediately. The loss is isolated. The system clears. Traditional finance does not work that way. Regulated institutions operate with accounting rules that allow under-margined positions to persist. Risk festers rather than clearing. And when the structured products — the auto-callables, the knock-in
Source PDF · page 3puts, the gamma-selling strategies — hit their trigger levels, the unwind is violent and reflexive. Dredge pointed to a structured product with a knock-in at $82,000 that coincided almost exactly with the market low. That is not coincidence. That is the new market structure hunting for the weakest hands.
This is the paradox of institutionalisation. Wall Street’s entry validates the asset class. The ETFs, the options chains, the prime brokerage infrastructure — all of it brings capital and legitimacy. But it also imports the exact fragility Bitcoin was designed to escape. The same engineering that suppresses volatility on the way up manufactures it on the way down.
These mechanics cut both ways. The structural forces that produce a drawdown of this magnitude in 48 hours can produce equally violent moves to the upside. Gamma squeezes, short covering cascades, forced re-hedging — none of it cares about direction. So this is not a blanket argument against a sharp recovery.
But in this instance, the violence of the move has pushed price well below the aggregate network cost basis for many new entrants. When that happens, it crystallises further selling as holders move into loss and patience erodes. Lower prices generate more supply, which generates lower prices. History says this dynamic needs time to exhaust itself before a durable bottom forms.
What I Missed
Before I get to what comes next, a brief post-mortem. Many of you saw my X post, so I won’t dwell on it here. But I owe you more than a thread. While I tend to have a long-term outlook, I appreciate that many invest on different time horizons. And even though my core positions are intended to capture the secular trend of blockchain adoption, there are times to be tactical.
The frustration I expressed in the X post was twofold: not de-risking more of the portfolio when the signals were there, and not being more helpful to those with shorter time horizons. I saw the risks building while most were dancing at the all-time high, a month before the October crash. I didn’t heed my own warnings.
Source PDF · page 4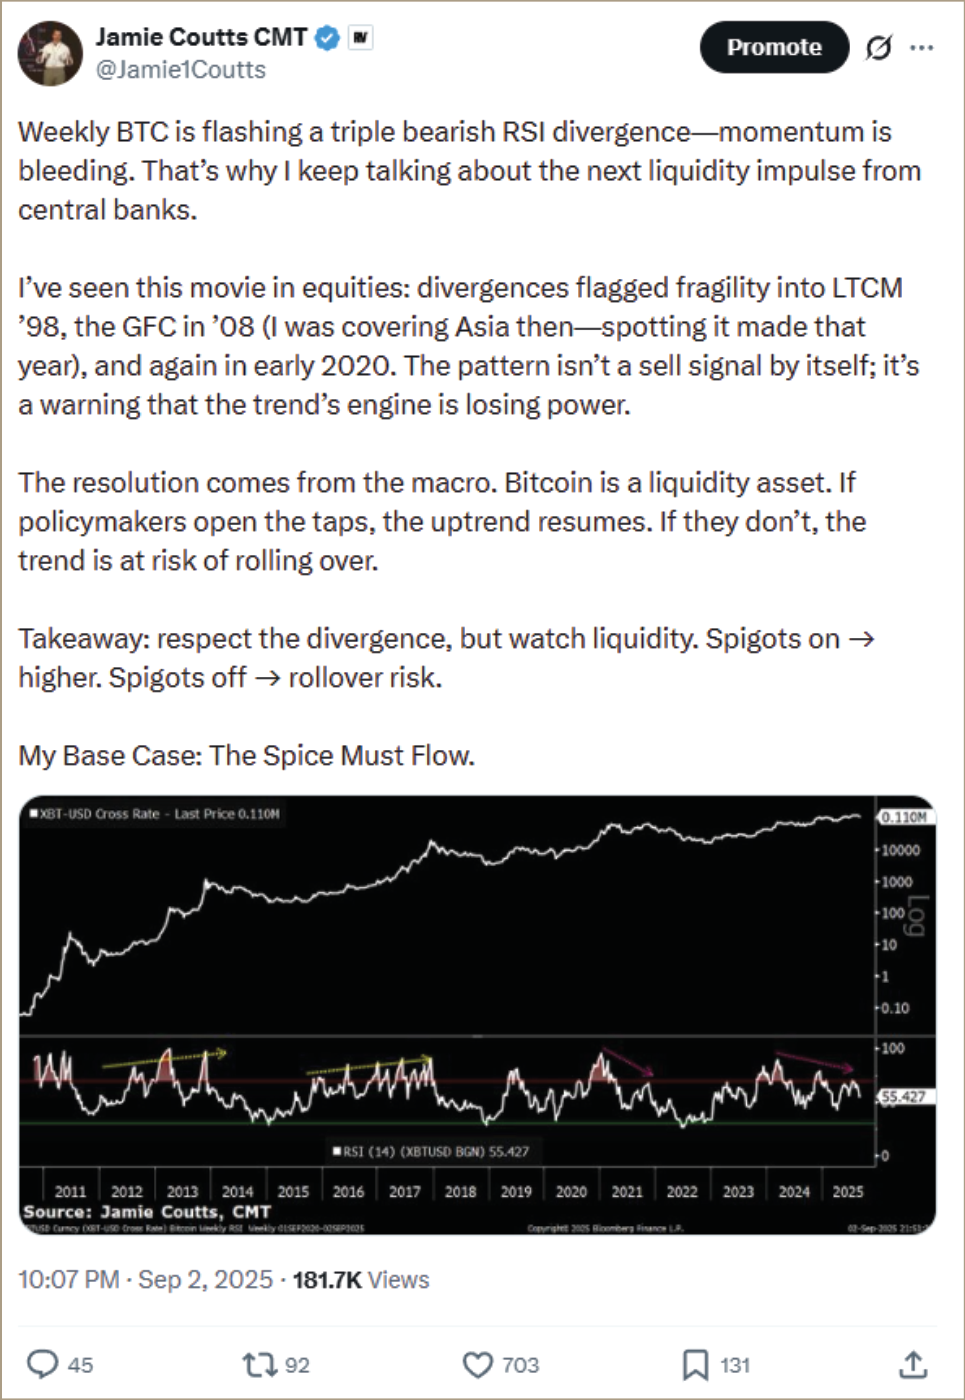
There is more to say on this, and I intend to address it through changes to the research product itself. More on that soon.
Now to what’s next: the path ahead and how we position for it. The price, derivatives, and onchain data give us the tools to map this out.
Source PDF · page 5My view in short: prices have overshot to the downside in the short term, and exhaustion signals are firing across multiple indicators. But as I laid out above, the structural damage means this will likely take months to repair. This report walks through the evidence for a short-term bottom, the indicators I am watching for a durable cycle low, and how I am positioning.
The liquidity picture will confuse this outlook and deserves its own treatment, which I plan to get to in the next report. In short, aggregate liquidity is improving through the treasury-commercial bank axis, which should favor productive assets broadly. That is not bad for crypto, but this mechanism alone does not create an instant bid when every marginal unit of new liquidity faces intense competition from other asset classes. The catalysts that change that equation, regulatory clarity advancing tokenisation, and the emergence of AI agentic payment rails, could be second-half events at the earliest.
Bitcoin faces its own protocol-level challenges this year (quantum computing, the security budget question, etc), but it has navigated these before. The honey badger endures.
The good news: bear markets don’t last forever, and a lot of the damage in this one has already been done. While capitulation signals have fired, that does not mean we have bottomed. Patience and selectivity will be key in the coming months, using weakness to accumulate the key assets that will capture the most upside from the secular trend in blockchain adoption.
Bitcoin’s First Rounded Top
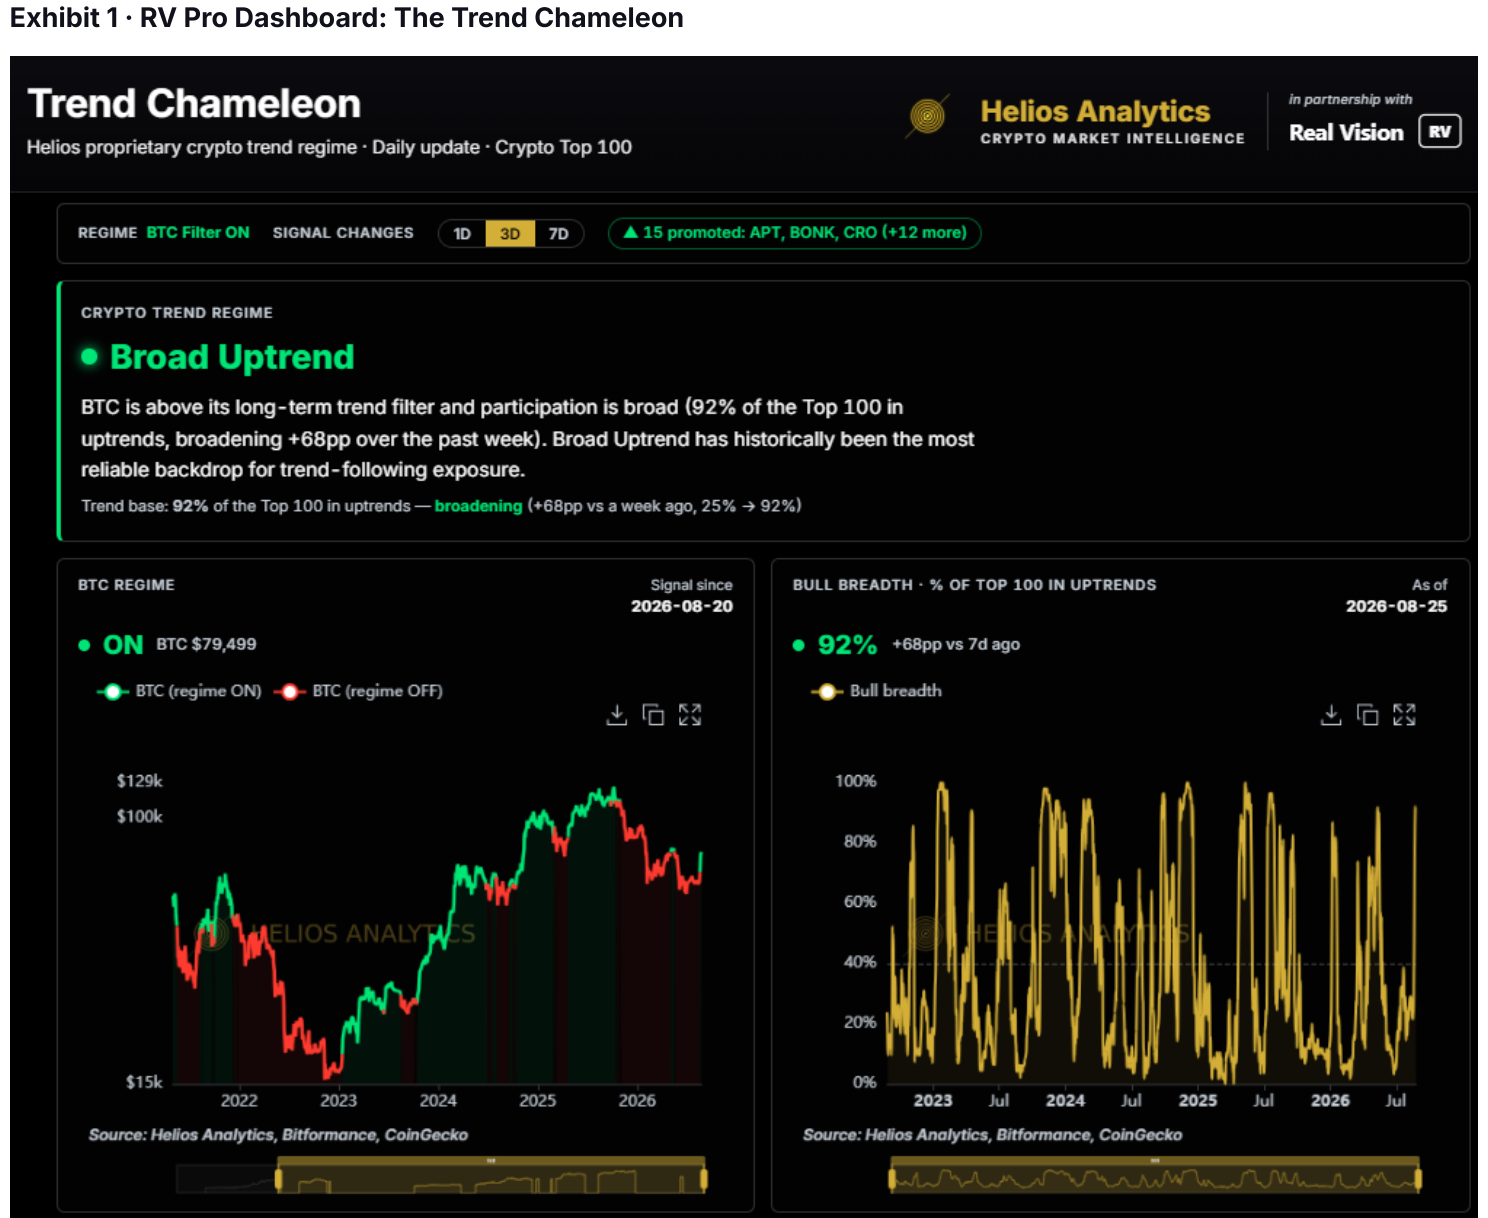
From a technical standpoint, it is clear to me that we are in a classical Bitcoin bear market. Negative momentum on multiple timeframes, followed by the break below key support at $79,000-$80,000, leaves no other conclusion.
I had always argued that Bitcoin returns would moderate as the asset matured and the slope of ascent would flatten. What we got was Bitcoin’s first rounded top; no parabola, no blow-off, but a 12-month distribution.
Source PDF · page 6Bitcoin Weekly Chart: Trend Chameleon and DeMark indicators
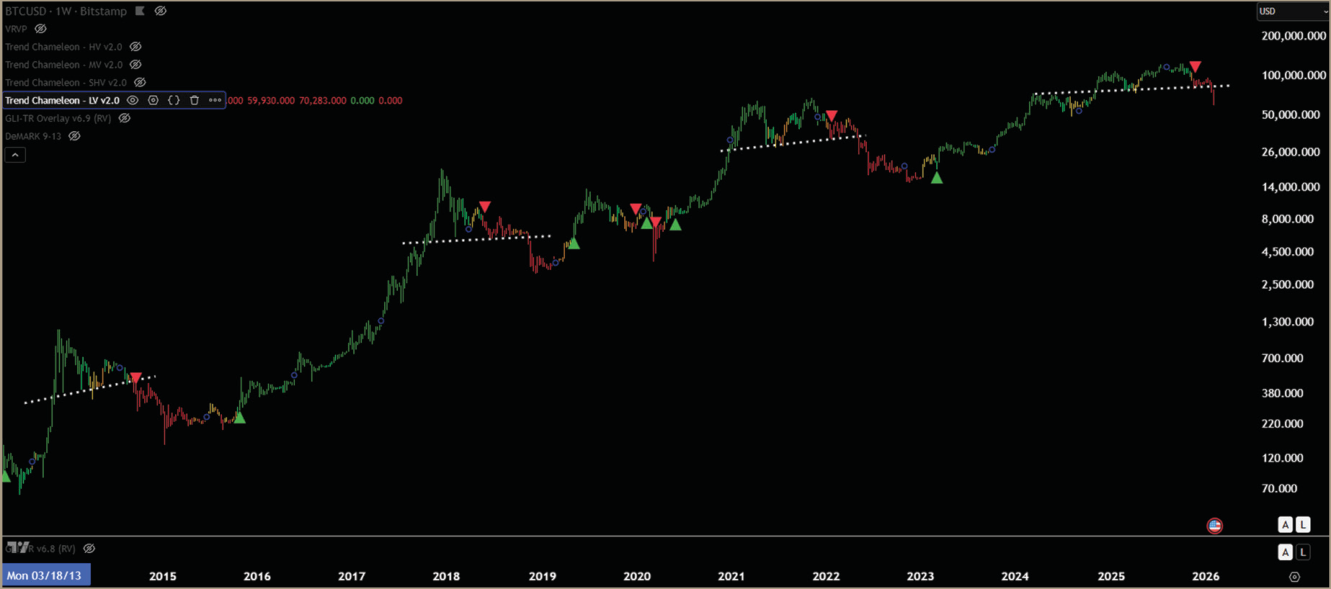
The fingerprints of a top were building well before October. The first wave came after the ETF launch in Q1 2024, then again in Q4 when Trump election euphoria and Strategy’s aggressive accumulation, monetising a 4-5x mNAV premium, pulled demand forward. The spikes in speculative activity were evident across funding rates and perpetual open interest, compounded by distribution waves from long-term holders.
Bitcoin Long-Term Holder Spent Output Profitability Ratio
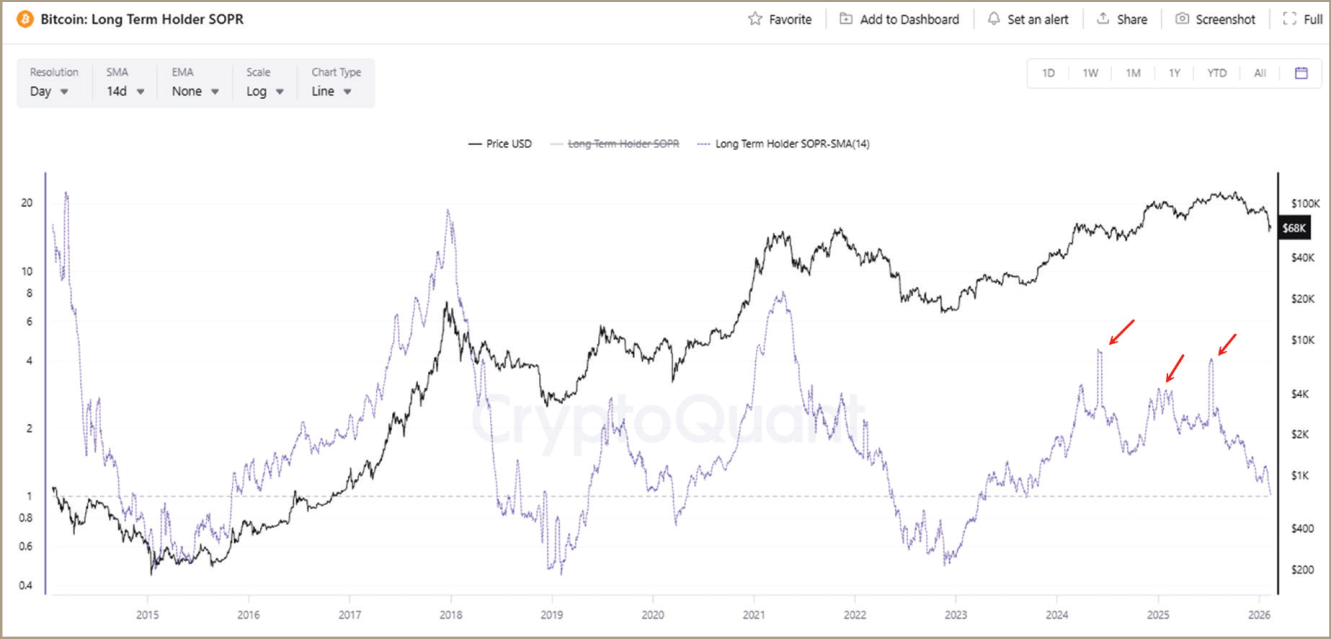
Source: CryptoQuant
** Long-Term Output Profit Ratio measures whether coins held >155 days are being spent in profit (>1) or loss (<1), isolating long-term investor behaviour by excluding short-term coin movements.
Source PDF · page 7The data showed up in the Bitcoin Cycle Risk Score (which was not developed until Q2 2025). The BCRS has now fallen to the most depressed levels in its short history. A framework that was flashing caution at the top is now confirming exhaustion at the bottom.
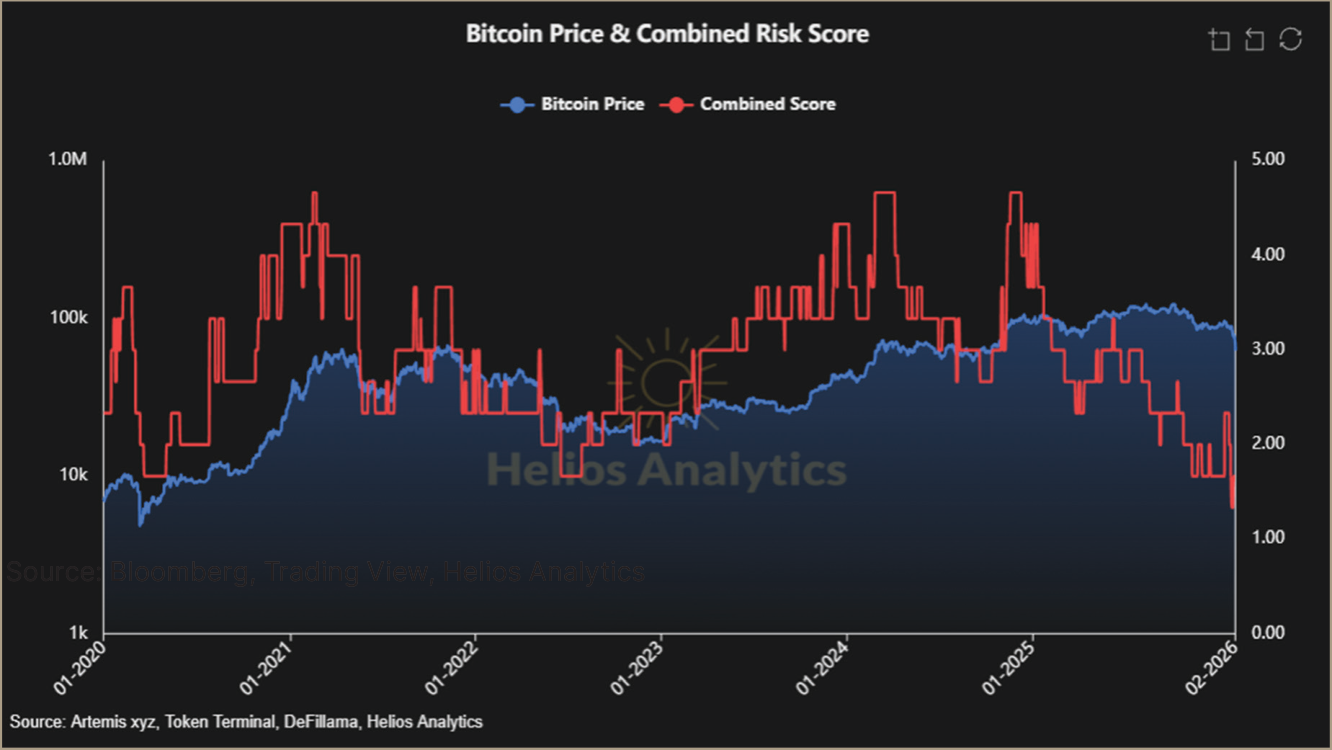
My outlook remained bullish through the Q1 tariff meltdown. In March, I added risk aggressively as the strong dollar that had weighed since November was reversing, and multiple tailwinds were aligning.
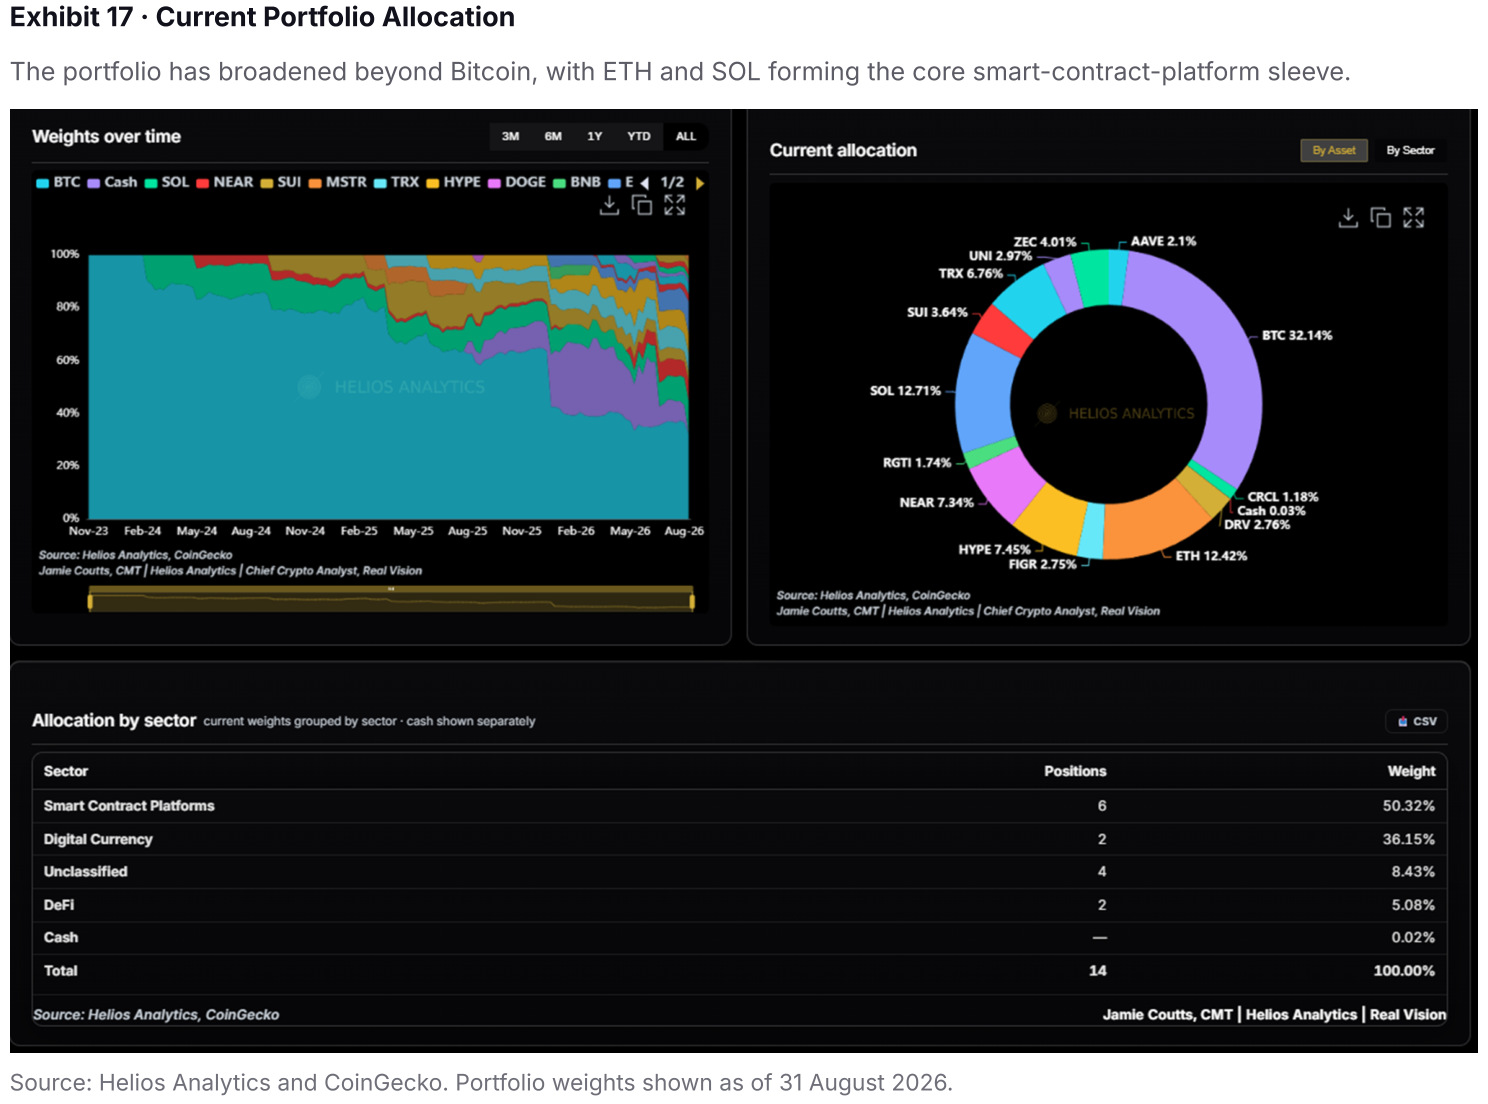
Helios Crypto Portfolio
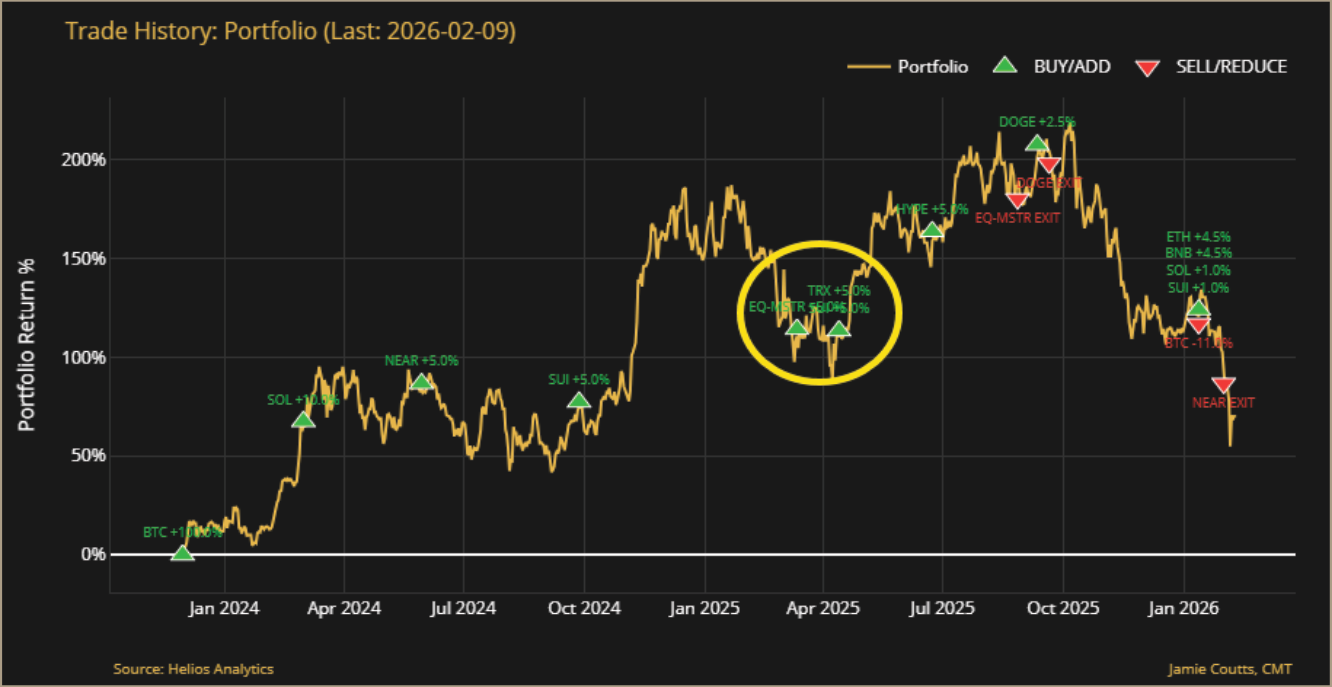
That call worked. The portfolio doubled in six months. But by August, momentum was diverging. Long-term holders, emboldened by the $100,000 psychological milestone, were using every rally to distribute. Bitwise’s Matt Hougan recently noted that while ETFs absorbed $75 billion in demand, long-term holder selling exceeded $100 billion. The supply side was winning.
Global liquidity had been stalling since July, and by October, that divergence was becoming a problem. I de-risked in September and October, but not nearly enough. Then the dominoes fell: the government shutdown seized the repo market, the Binance fraud triggered a cascading unwind in spot and derivatives, capital rotated hard into AI infrastructure, and the bank derivatives complex amplified every leg lower.
Repo rates blew out, forcing the Fed to pivot and begin balance sheet expansion. The pivot, a weakening dollar, and a turn higher in my GLI-TR model kept me bullish into January. I stayed long and even added risk (ETH for the first time) in the face of deteriorating price action, convinced that improving liquidity would override the damage. That was a mistake.
Global Liquidity Trend Regime (GLI-TR) Model
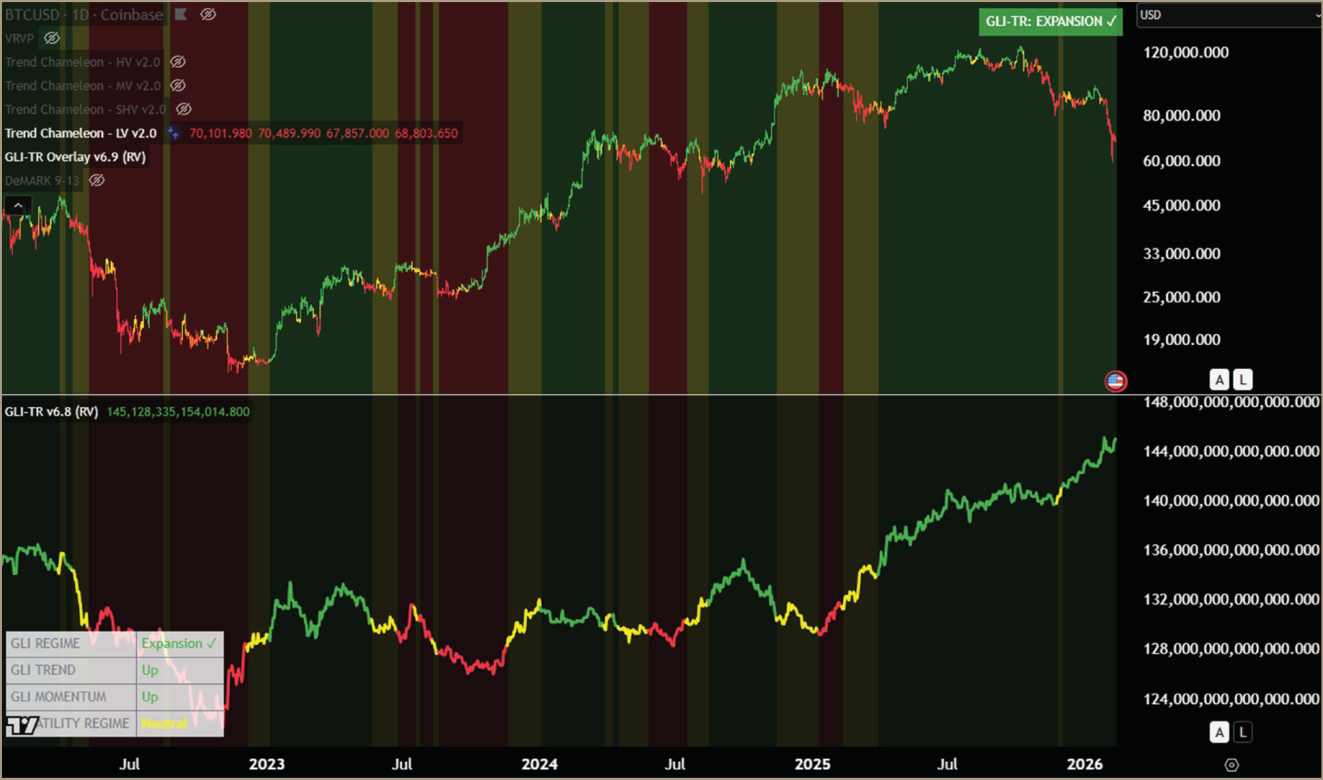
That’s the post mortem. Bitcoin is down 47% from its peak, and the Bitformance Altcoin Index is down 55%. The question now: what can we expect from here?
Source PDF · page 9Six Signals of Exhaustion
I am going to walk through six indicators below. I used many of these signals to identify the 2022 cycle low and the mid-cycle lows recently (2024 and 2025). Together, they build a strong case that last week marked a significant capitulation event. But the difference this time is that we are not early cycle. The structural damage across technicals and onchain metrics raises a harder question: whether $60,000 marks the cycle low or just another leg down in a longer process.
1. Bitcoin Relative Strength Index (RSI)
The first sign of a potential cycle low is the Weekly RSI. Last week, the RSI fell below 30, only the fourth time since 2012. This is an exceptionally rare signal, and each prior occurrence has coincided with a major cycle low.
Bitcoin Weekly RSI <30 Signal
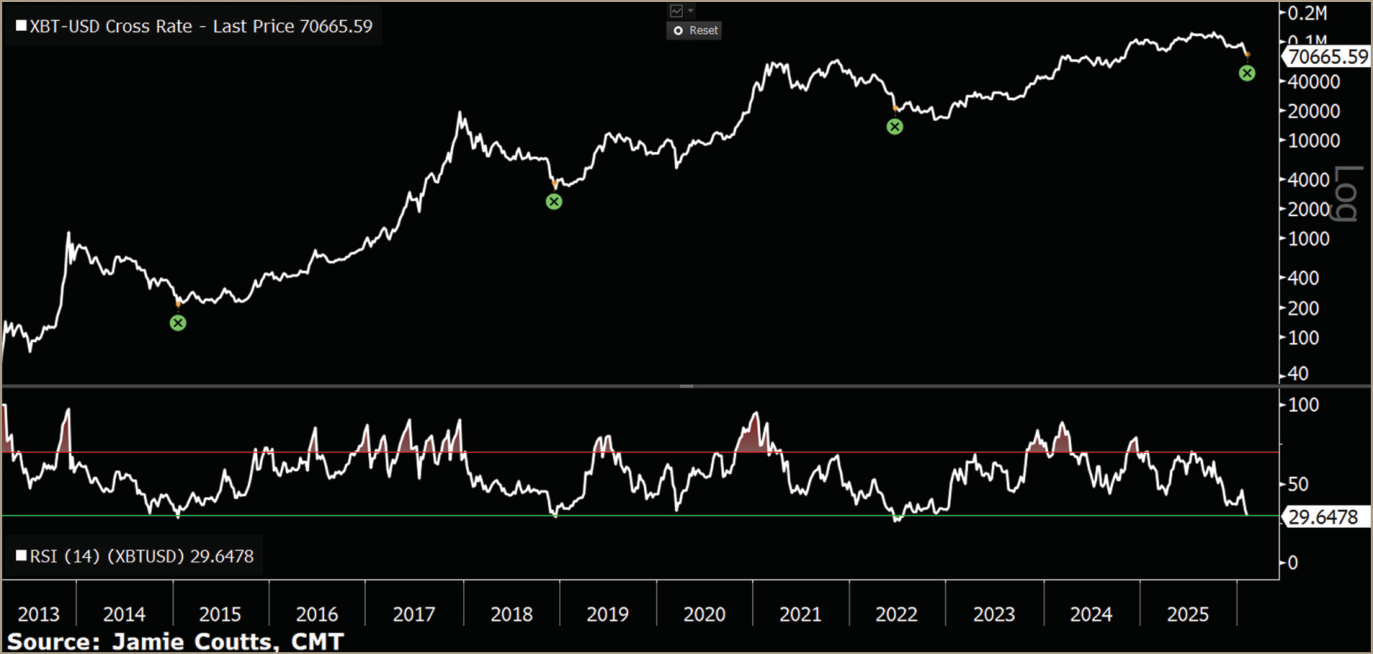
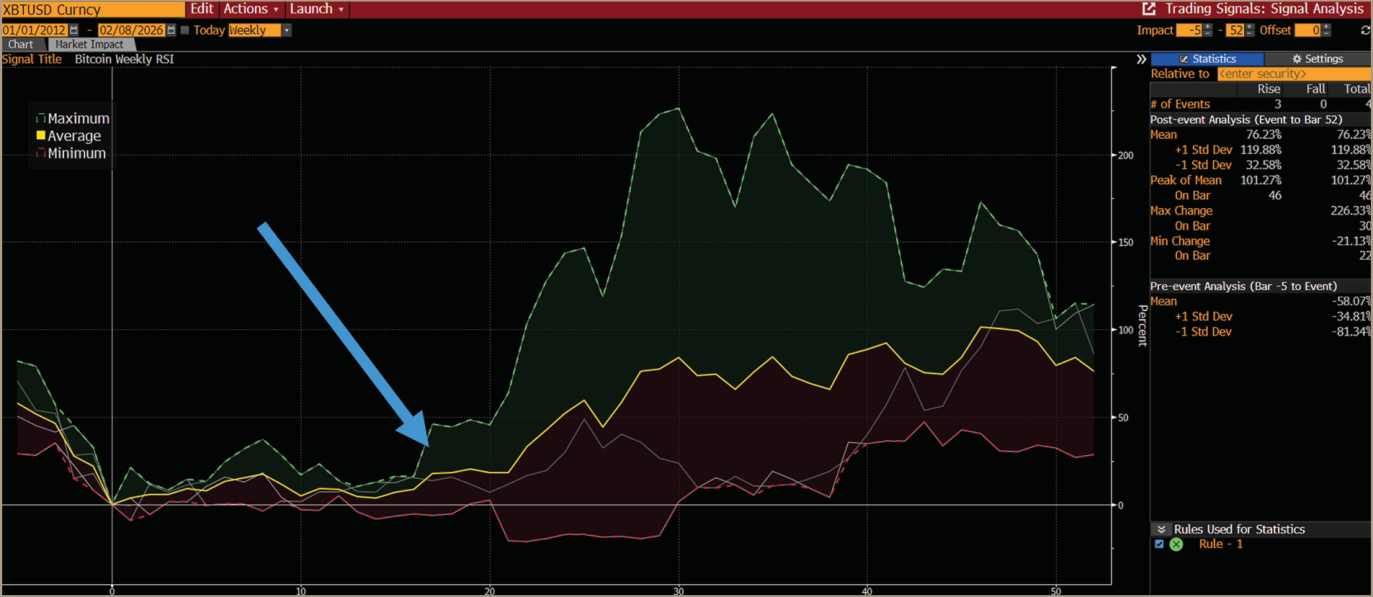
If history is a guide, the RSI signal fires early. It typically takes several weeks to months before Bitcoin begins its sustained recovery.
Source PDF · page 10Bitcoin Weekly RSI < 30 52 Week Returns
2. Extreme 2-Day Selloff
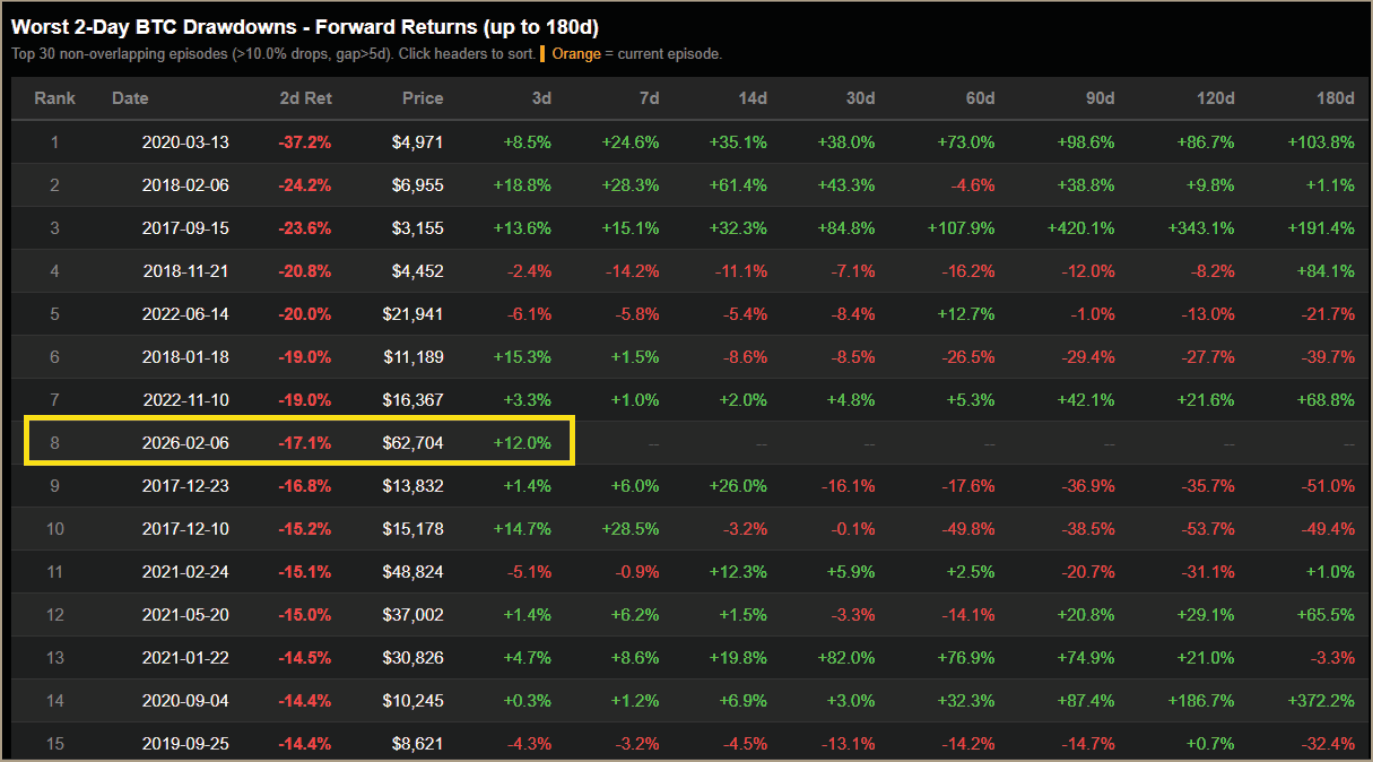
Last week’s 2-day decline of 17.1% was the 8th worst on record since 2017 – an extreme outlier corresponding to roughly a 0.02% probability (1-in-4,000). Drawdowns of this magnitude have consistently produced a sharp near-term bounce, but the reality is that the signal deteriorates as you extend the window forward.
Worst 2-day BTC Drawdowns since 2017
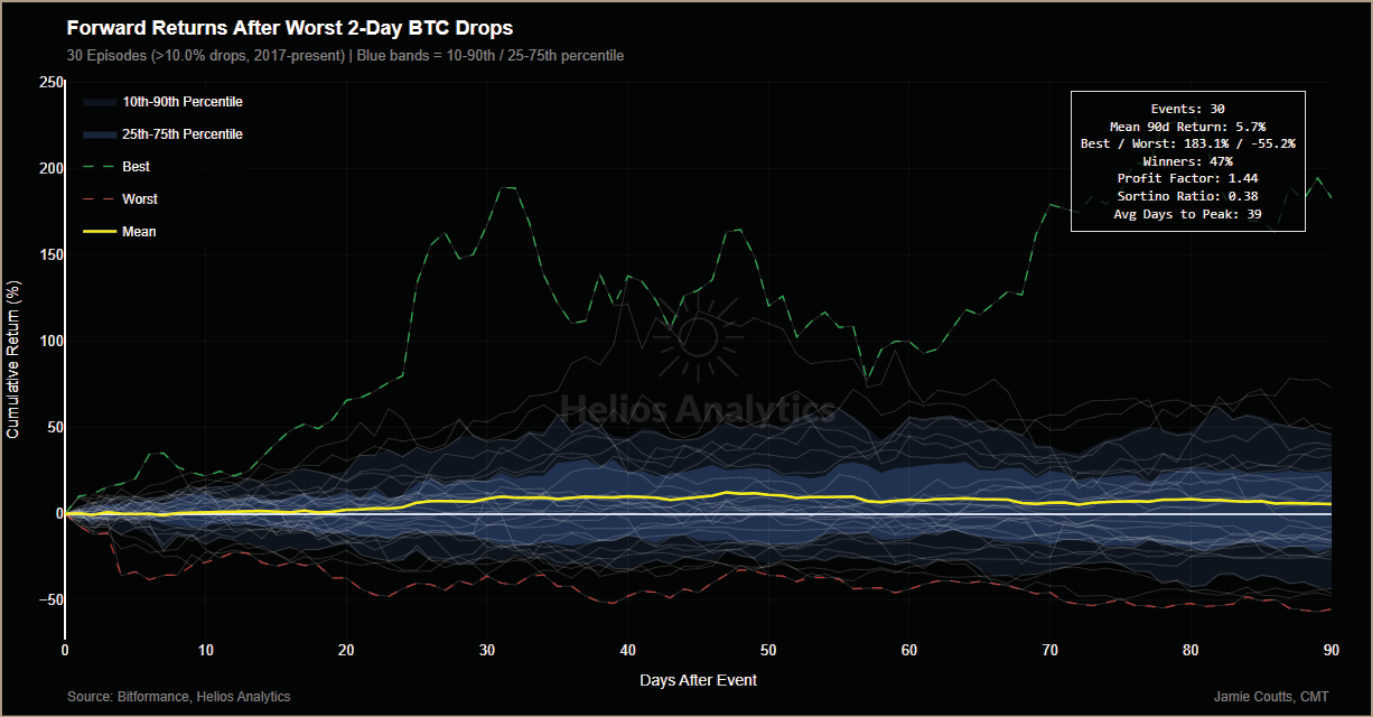
Over the 90-day forward period, the mean returns following the worst 2-day drops are overwhelmingly bullish, with winning trades roughly double the size of losers. But the hit rate is only 38% for longs, meaning the returns are positively skewed but far from a sure bet.
Forward Returns After Worst 2-day BTC Drops
3. Bitcoin Perpetual Futures Funding Rates
The derivatives landscape has evolved dramatically since the last cycle, and this is where Dredge’s dry brush becomes tangible. The growing influence of CME cash-settled futures, the explosion in IBIT options trading, gamma-selling strategies run by hedge funds, and the proliferation of structured products from U.S. bank structuring desks (Morgan Stanley, Goldman Sachs, JPMorgan) have fundamentally altered how leverage builds and unwinds in this market.
The institutions building these products have a vested interest in eliminating competition. I detailed this in November through the lens of Strategy, where JPMorgan hiked margin requirements into declining volatility while simultaneously launching IBIT-linked structured notes for private clients. The quiet part: every dollar flowing into a fee-free Bitcoin equity wrapper is a dollar not flowing into bank-issued ETFs, structured notes, or custody revenue lines. That dynamic has only intensified since.
While the derivatives are changing Bitcoin’s market structure, some things never change, namely, volatility suppression always leads to volatility expansion.
Source PDF · page 12And what we saw last week was the 4TH biggest negative funding rate spike on record. Historically, extreme negative funding spikes have been one of the best predictors of strong positive forward returns - they indicate forced liquidation and capitulation among leveraged longs.
Funding Rate Component: Blended Z-Score
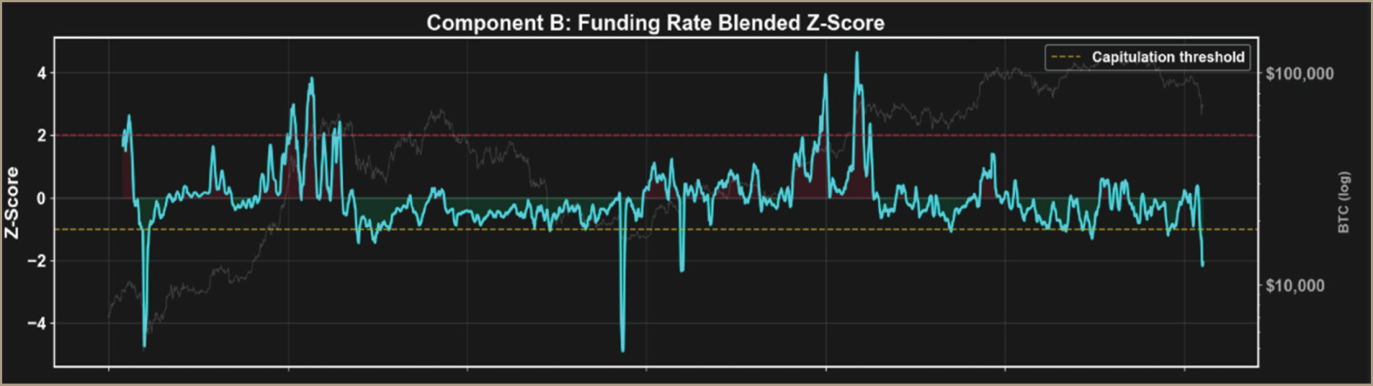
The massive negative funding spike pushed my custom Derivative Risk Score (DRS) to 1, signifying extreme bearish positioning by perps traders.
Helios BCRS Dashboard
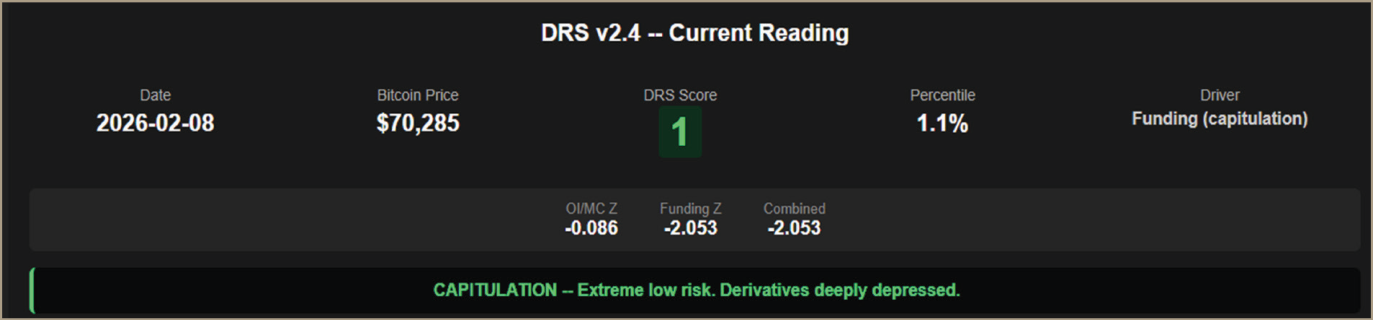
Helios BCRS Dashboard
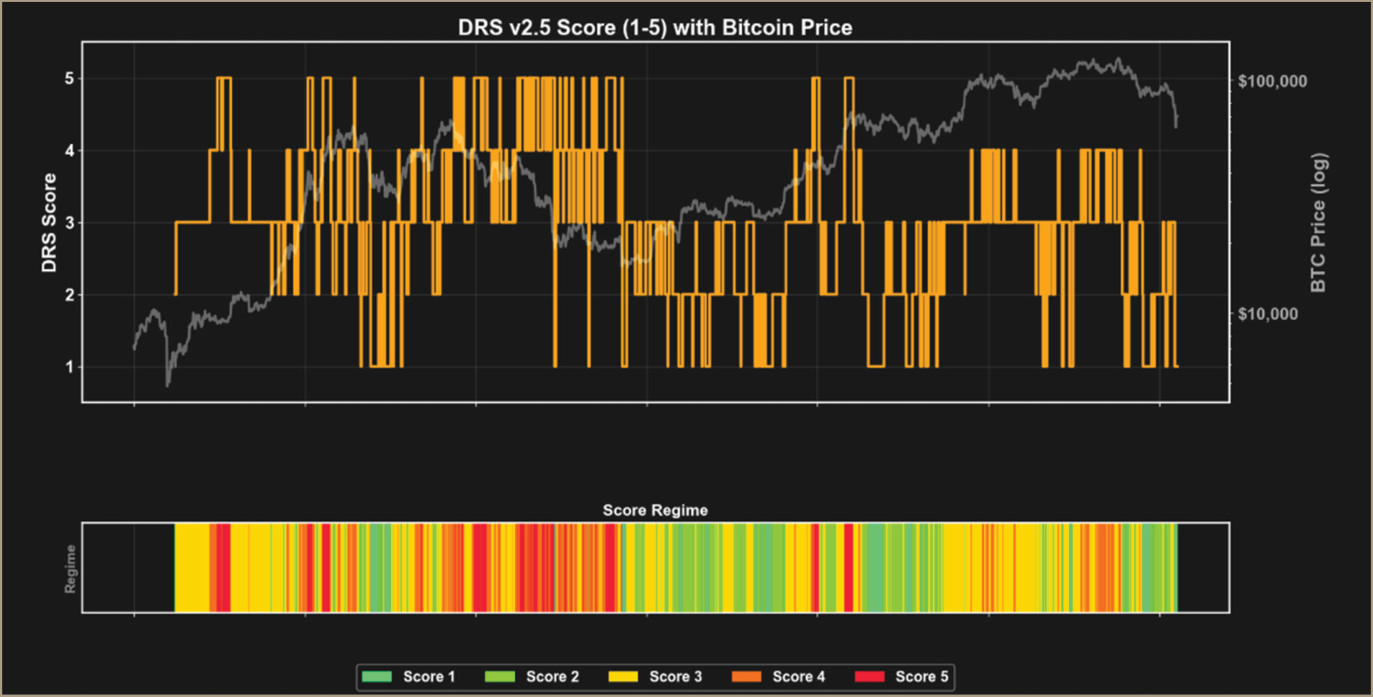
The DRS ranges from 1 to 5. Scores of 4-5 have historically coincided with market tops when leverage is extended. A score of 1 marks capitulation when leveraged positioning has been flushed.
Helios BCRS Dashboard: DRS at Key Historical Dates
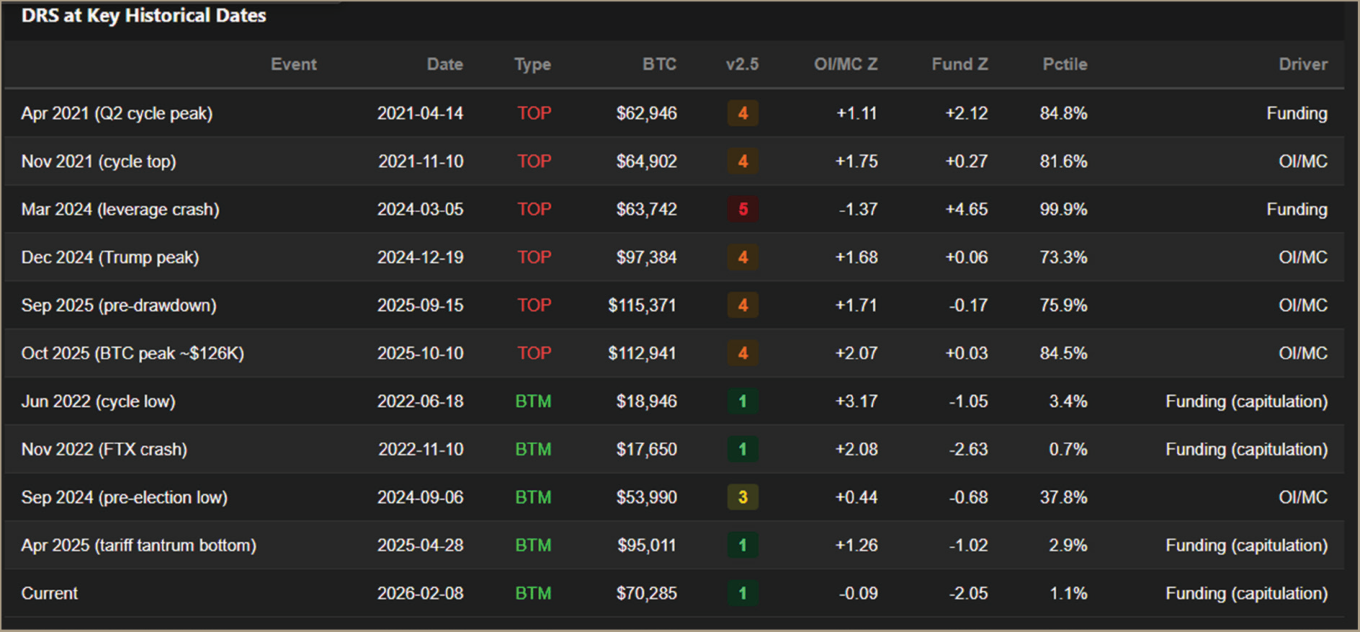
Across all timeframes from 30 to 365 days, when the DRS reaches 1 or capitulation territory, forward returns have been very positively skewed. This is perhaps the strongest indicator in the toolkit that points to last week’s move as a significant low for Bitcoin.
DRS 90d Forward Returns for the BCRS Dashboard
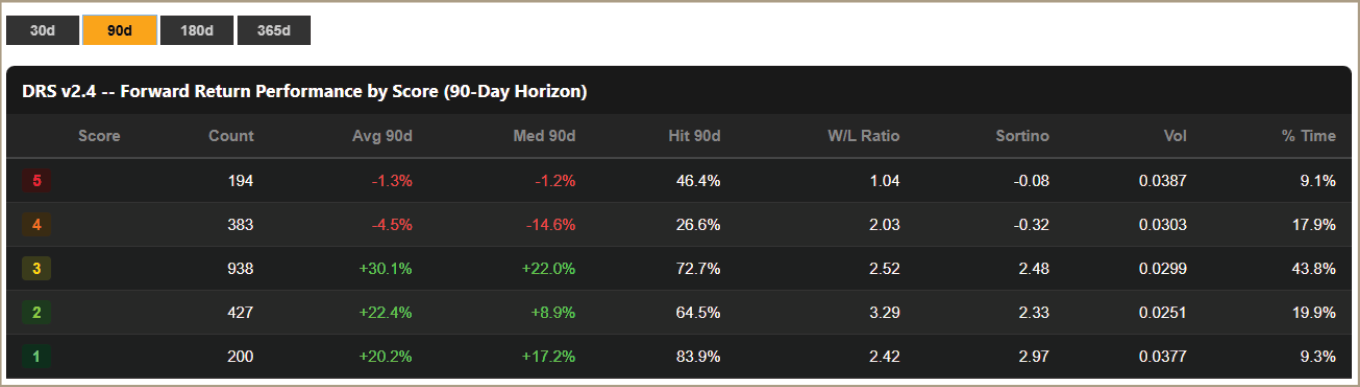
DRS 90d Forward Returns for the BCRS Dashboard
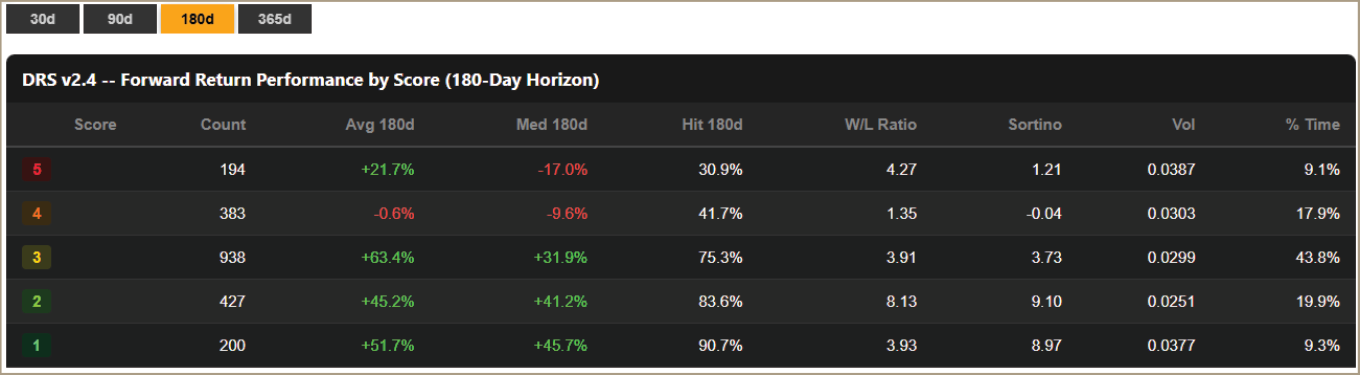
Source: Helios Analytics, CrytpoQuant
Source PDF · page 15Futures Liquidations
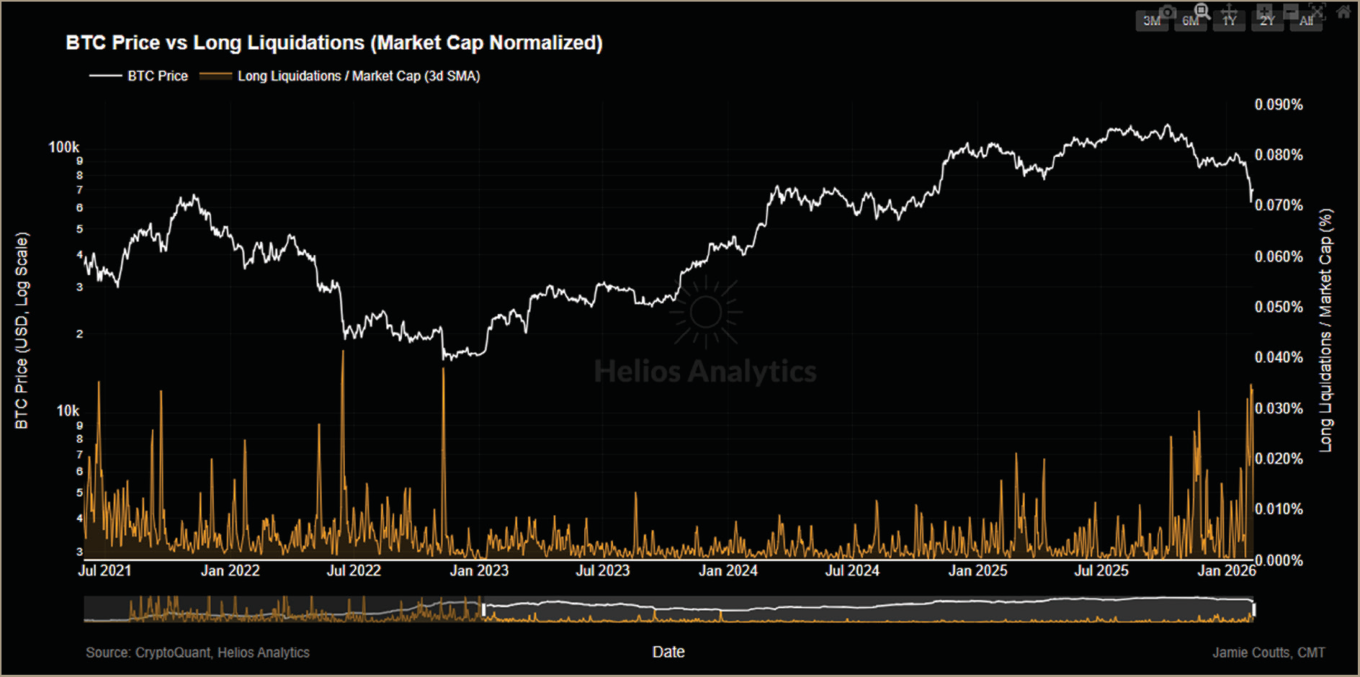
As funding rates blew out, $1.3 billion in long positions were liquidated over two days, between February 5 and 6th. These losses matched the October 10th and 11th 2-day liquidation event, which kicked off this whole mess.
As a percent of market cap, these were the highest levels since June 2022. In that instance, Bitcoin was trading at roughly $20,000 at the time, but there was one additional flush (FTX) before the ultimate cycle low.
4. Onchain Realised Losses
On the spot side, realised losses as a percent of market cap are currently on par with the mid-cycle 2021 reset triggered by the China mining ban. They remain below the levels seen during true holder capitulation events in 2022 and 2018.
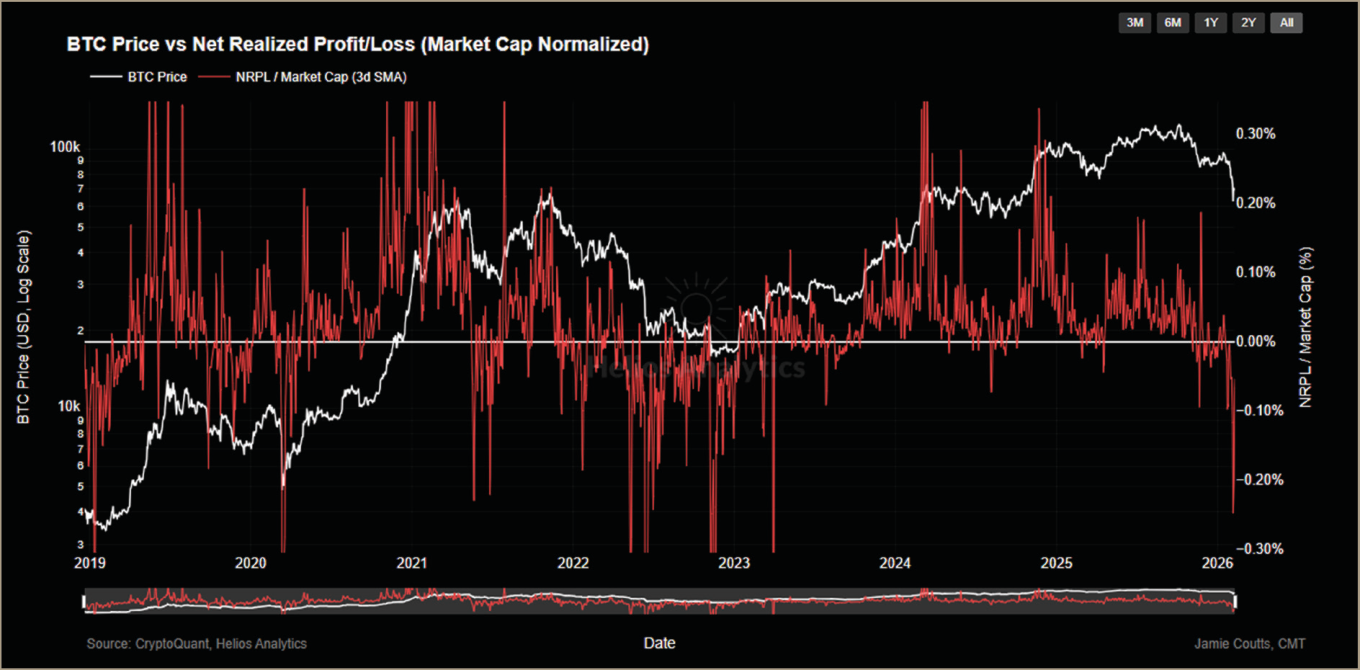
Most of the pain this cycle has been concentrated in derivatives. Leveraged participants have been shaken out, but spot holders have not yet capitulated at scale.
However, Bitcoin is now trading below the True Mean Price, which tends to crystallise additional selling as holders move into a loss. Lower prices generate more supply, which generates lower prices.
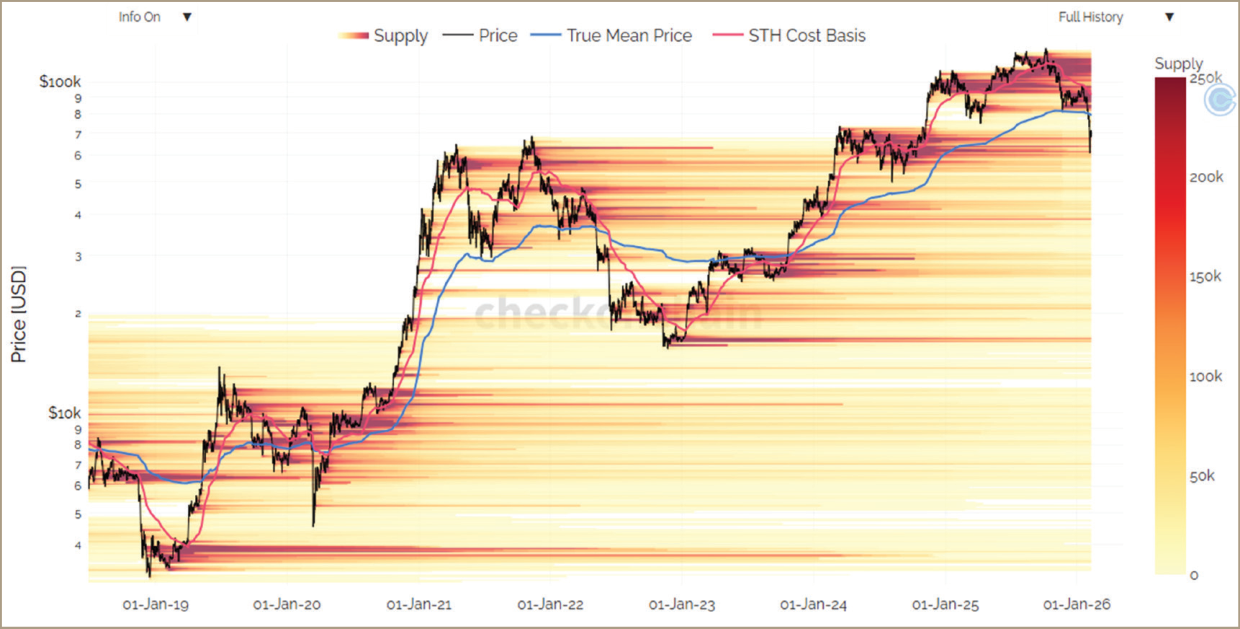
The UTXO Realised Price Distribution shows heavy supply concentration around $80,000, meaning a significant volume of coins changed hands at that level.
Source PDF · page 17Supply Distribution Heatmap
Source: Checkonchain
The heatmap confirms that the $75,000-$85,000 range is the densest concentration of supply in the current cycle. Until Bitcoin reclaims this zone and converts overhead supply from resistance to support, rallies will be capped or slow.
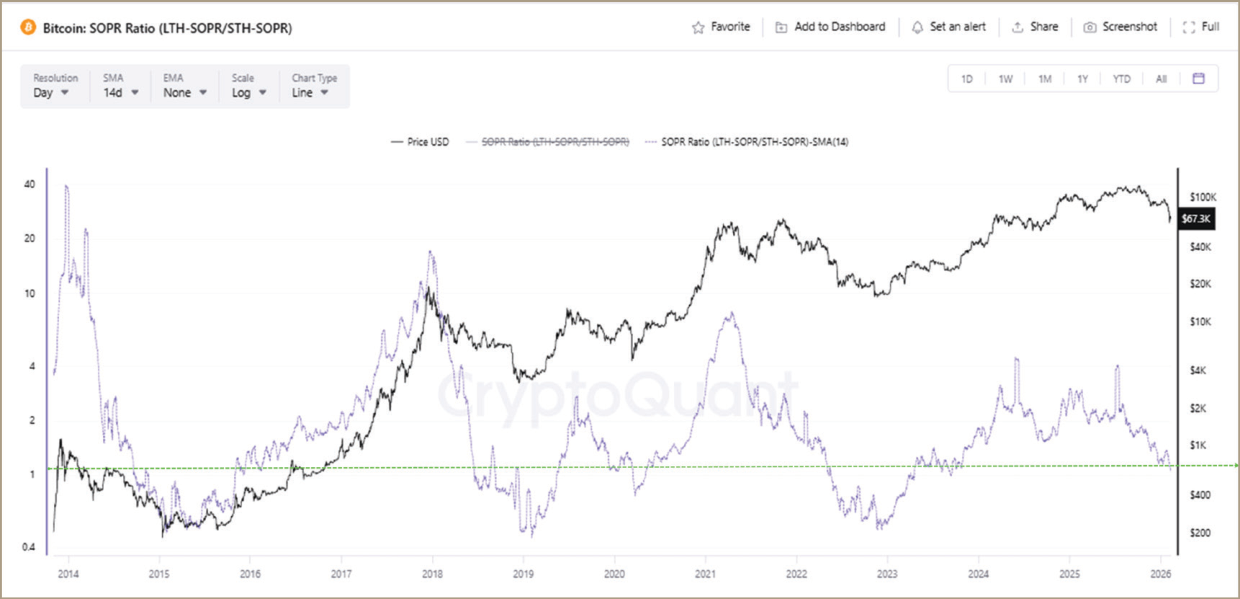
One positive: long-term holders who were aggressively distributing on the way up have pulled back at current levels. The purple SOPR ratio line trending lower confirms that short-term holders are now the most aggressive sellers.
Bitcoin Long Term vs Short Term Holder Spent Output Profitability Ratio (SOPR)
Source: CryptoQuant
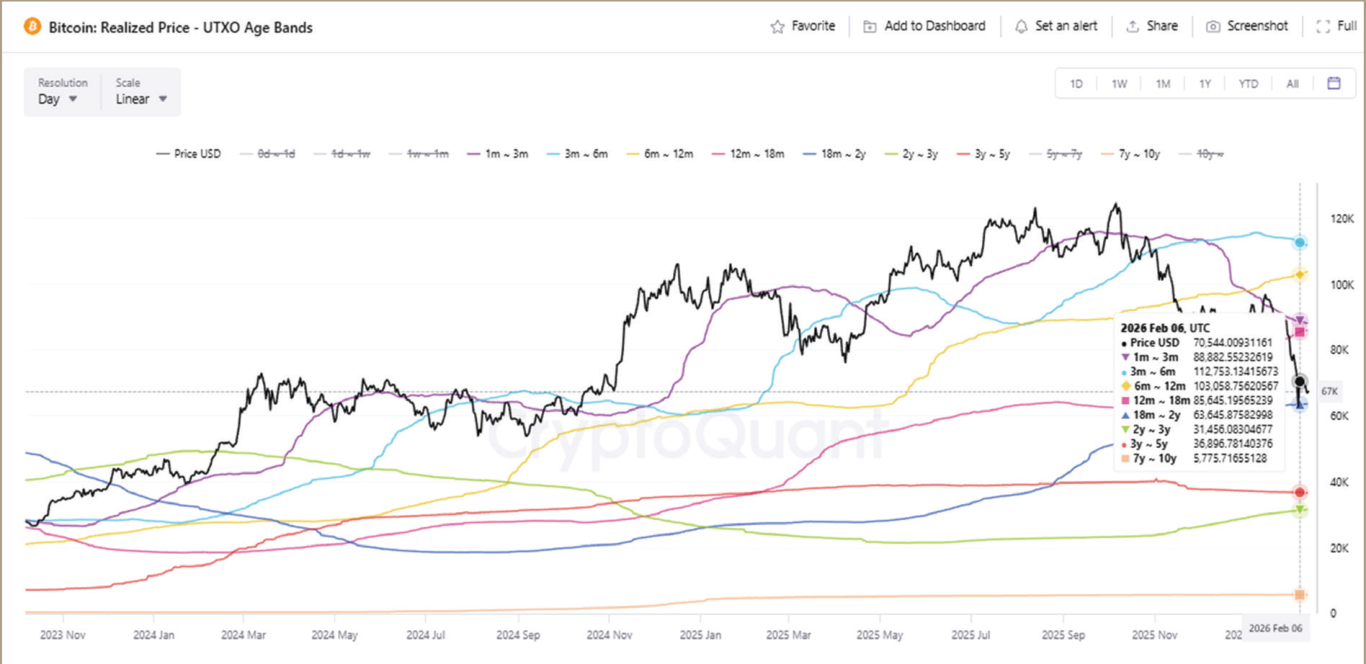
Source PDF · page 18Which, as the chart below shows, makes sense: the aggregate cost basis for anyone who bought in the past 18 months is underwater, which explains why.
Bitcoin Realized Price – UXTO Age Bands
Source: CryptoQuant
5. The Realised Cap
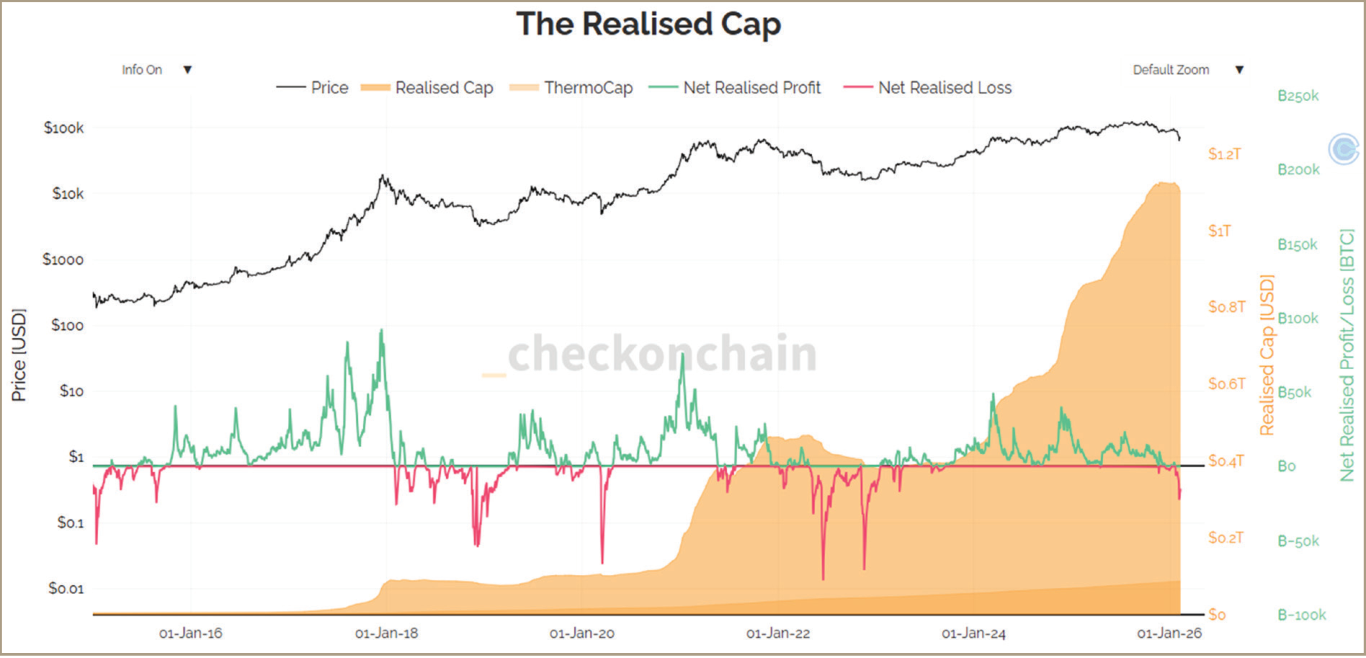
The Realised Cap captures the aggregate cost basis of the entire Bitcoin network. When it rises, new capital is entering. When it rolls over, more value is being destroyed through losses than created through gains. This is a slow-moving metric that does not reverse easily. It has now started to turn lower, as it did in 2018 and 2022. Until this reverses, the bottoming process is not complete.
The weight of evidence across the onchain data suggests there will be opportunities to add at either lower or similar levels in the coming months.
Source PDF · page 19Bitcoin Realised Cap
Source: CheckonChain
6. Crypto Market Breadth
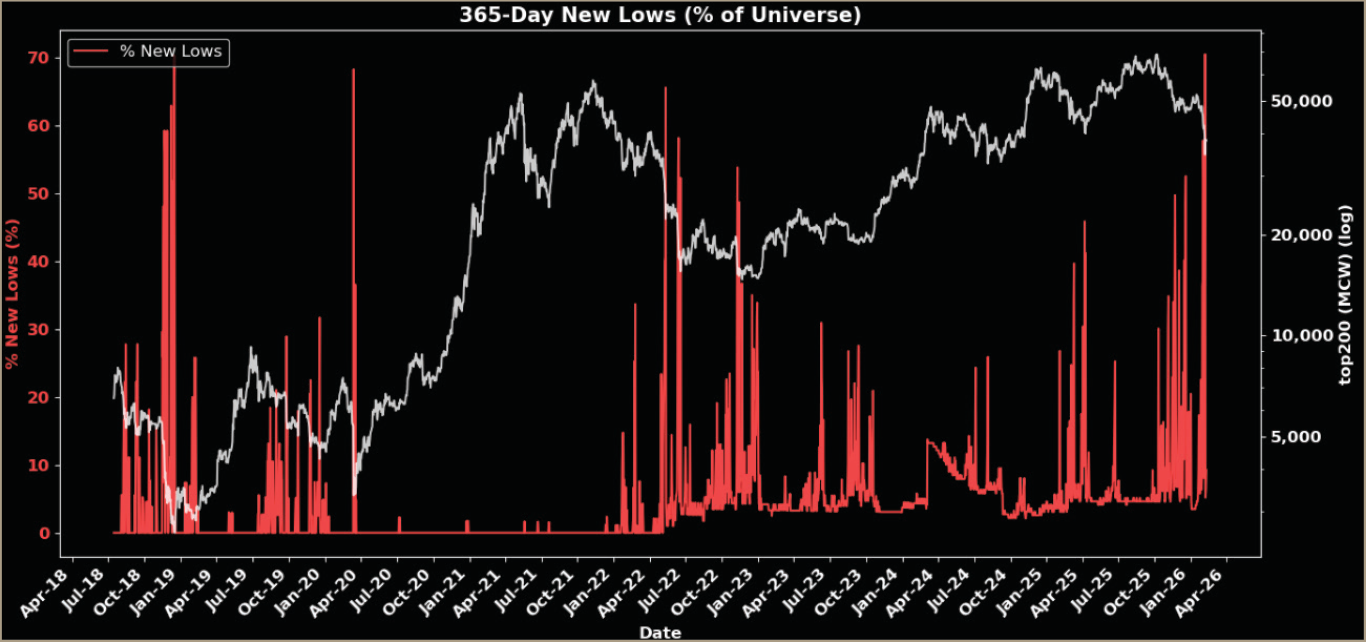
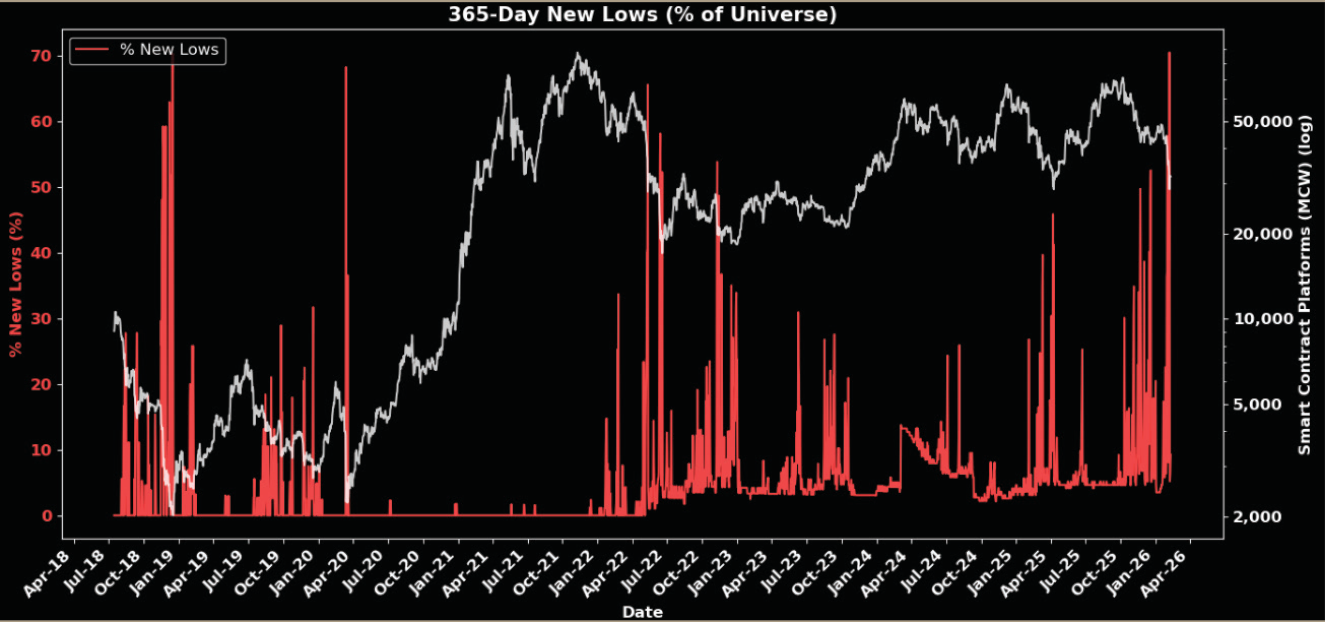
The percentage of Top 200 crypto assets making 365-day new lows has hit 68%, surpassing the 2022 bear market lows and rivalling the December 2018 and March 2020 capitulation events. This is an extreme reading by any historical standard, and one that has coincided with major bottoming zones.
Crypto Top 200 365-day New Lows
Source: Helios Analytics, Bitformance
Source PDF · page 20Top 200 SCP Sector 365-day New Lows
Source: Helios Analytics, Bitformance
Keep in mind these are market-weighted indices, which don’t illustrate the absolute carnage beneath the surface. The vast majority of these protocols are dead tokens walking.
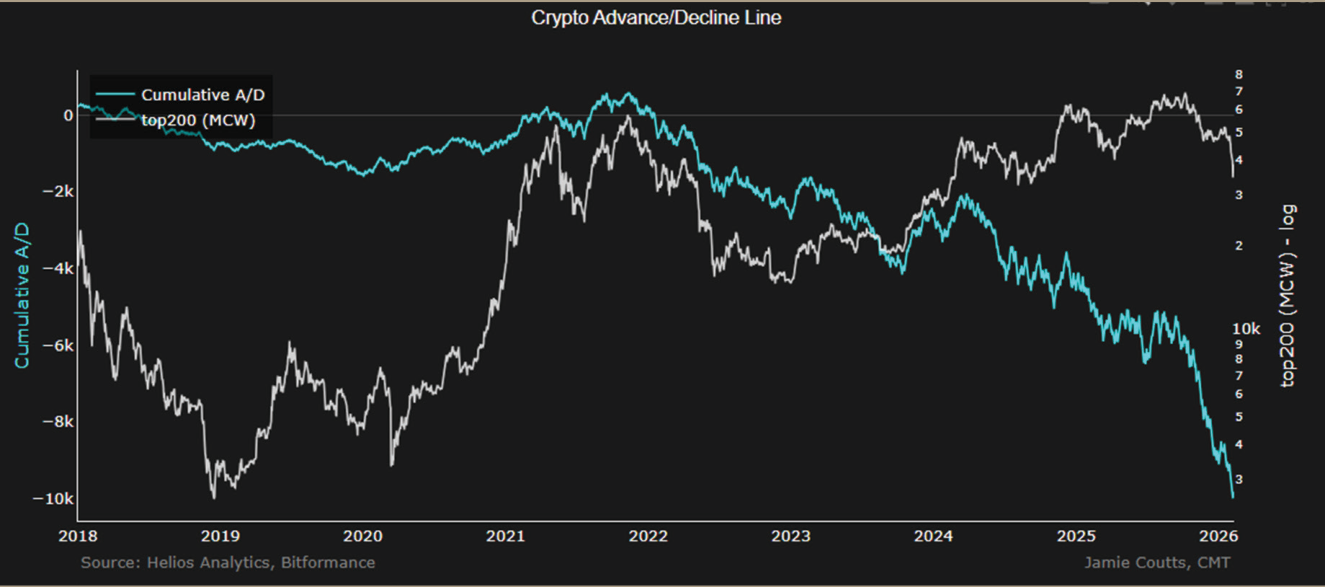
The cumulative advance/decline line, which tracks the running total of assets making new highs minus new lows, has been in a structural downtrend since early 2021. This confirms that the alt market bear predates the Bitcoin crash by years. This trend is a large part of why my positioning centres on Bitcoin, Ethereum, and Solana, and the other large SCPs: the assets absorbing the lion’s share of activity, capital, and developer attention while the rest of the market quietly dies. What we are seeing now is the capitulation phase of a much longer deterioration.
Crypto Top 200 Cumulative Advance/Decline Line
DeMark Capitulation Levels
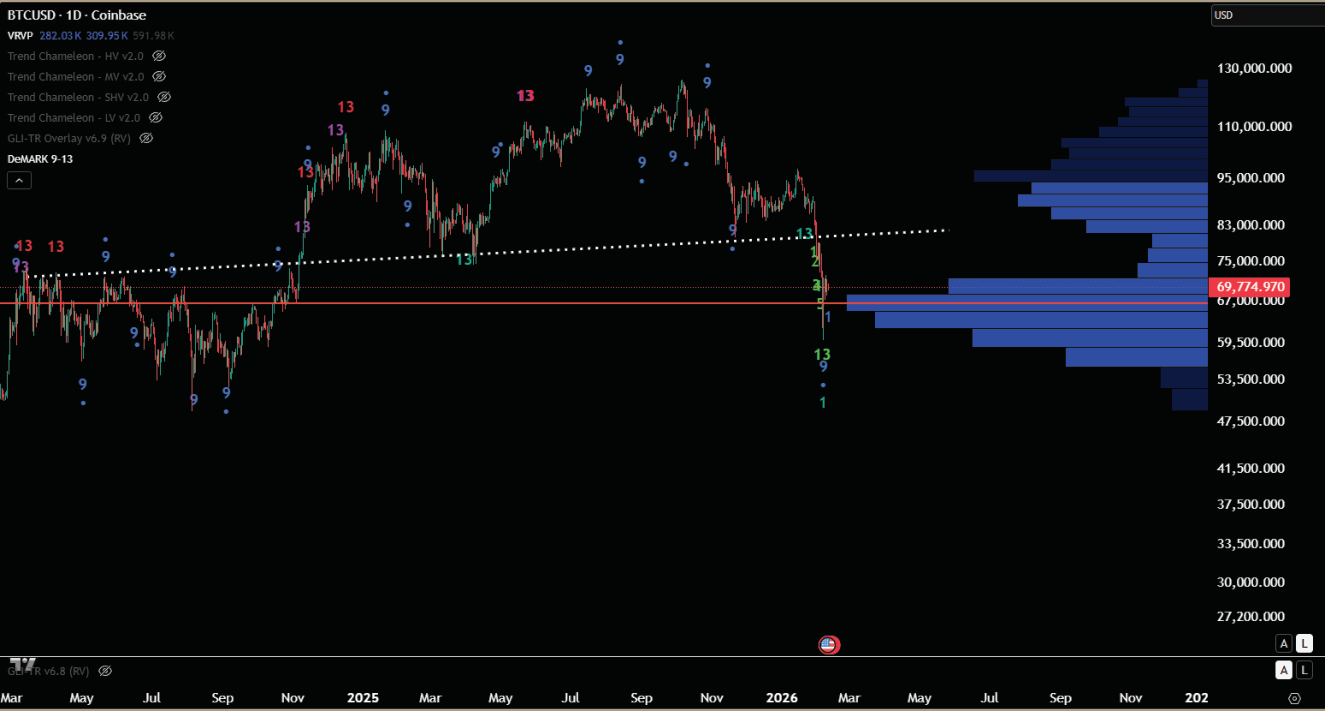
One of the main reasons I still expect further downside before a durable low: I have not yet seen DeMark Sequential 13 exhaustion counts on the weekly timeframe, which has been the most reliable reversal signal in prior bear markets. Here is where the counts stand across the key assets.
Bitcoin has registered a DeMark Sequential 13 on the daily chart. That matters as the benchmark asset. A daily TD 13 at these levels, where capitulation readings have fired across multiple other indicators, adds to the weight of evidence that significant seller exhaustion was reached on the wick below $60,000.
Bitcoin Daily Chart: DeMark Indicator
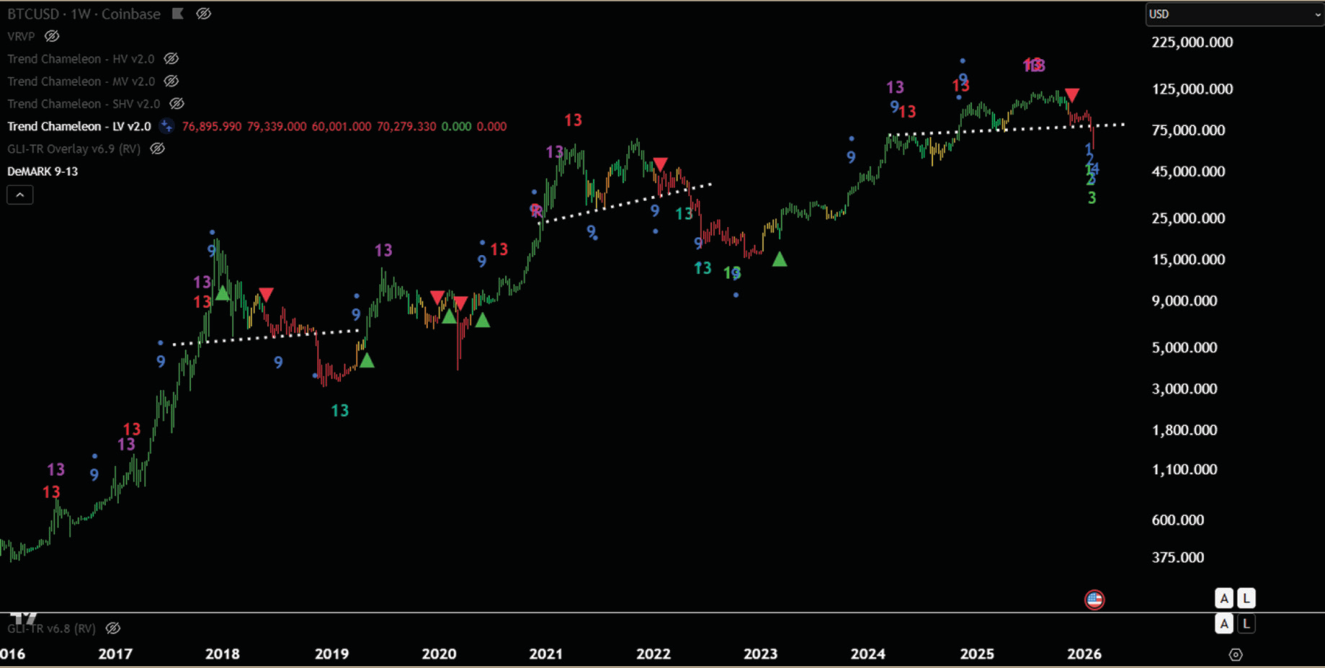
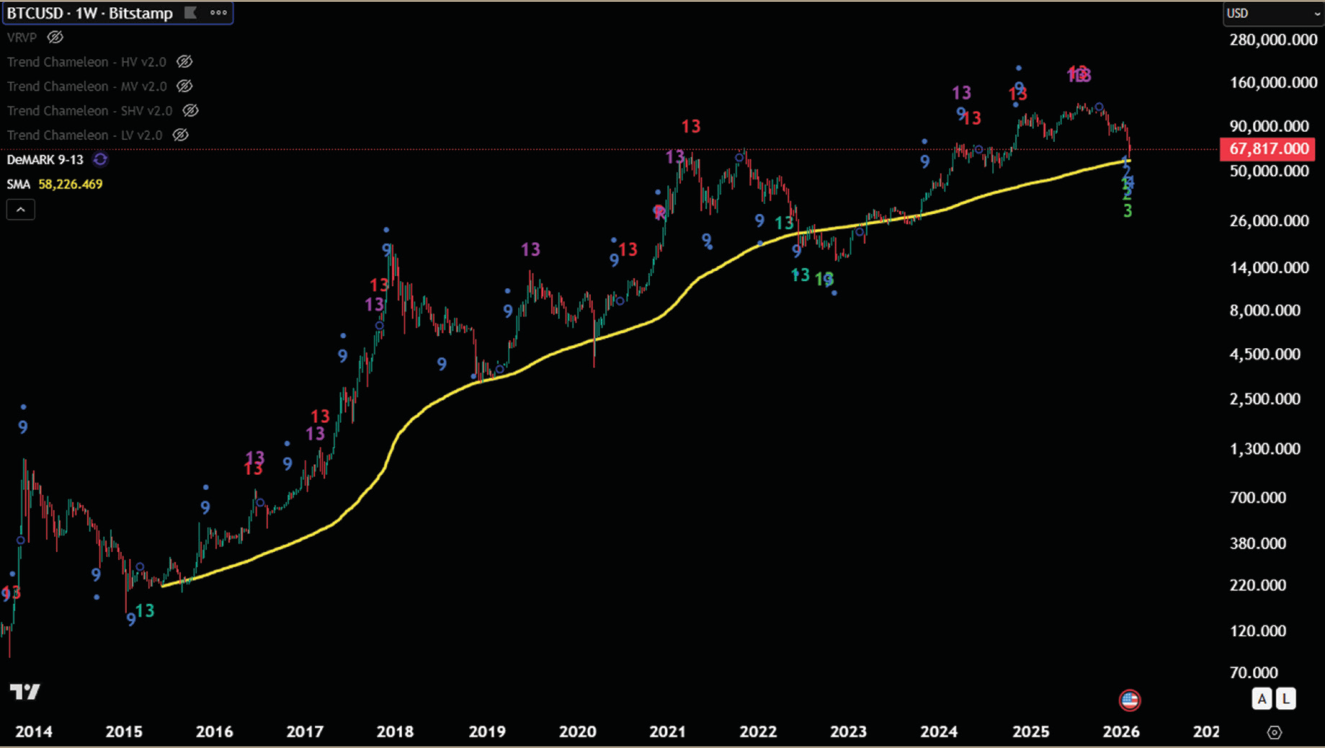
However, the past two bear markets only ended once a weekly 13 printed. The current weekly count is just 3. For me, this is too early to position with full conviction.
Source PDF · page 22Bitcoin Weekly Chart: DeMark & Trend Chameleon Indicators
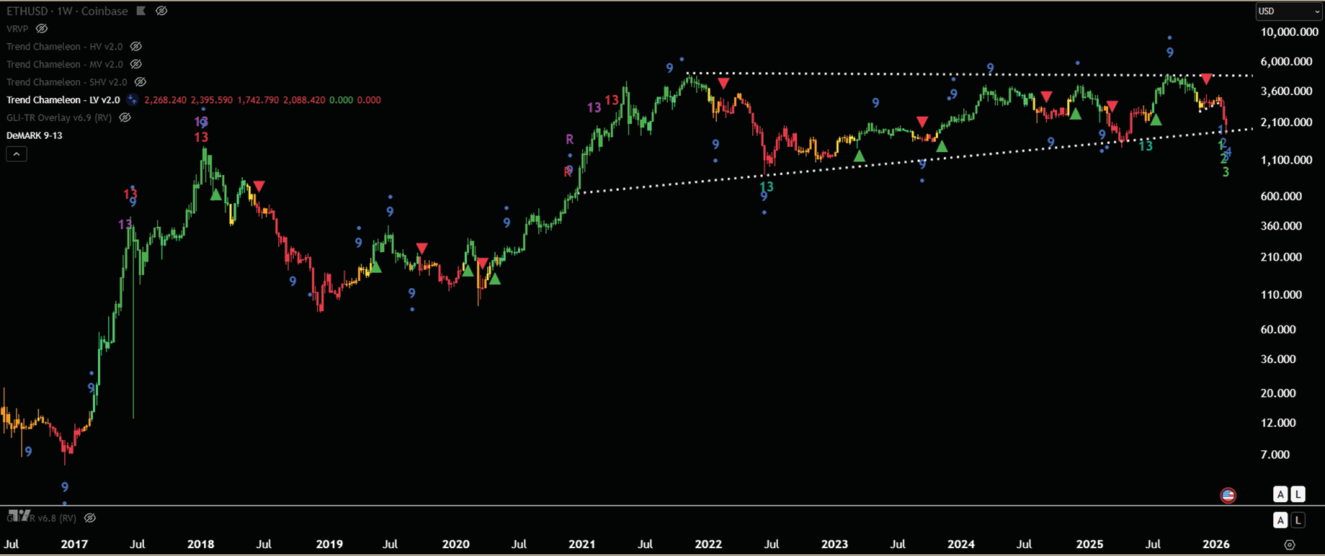
Ethereum has not yet completed a DeMark exhaustion count, even on the daily timeframe. ETH is still searching for its short-term low, which I expect within the next one to two weeks.
Ethereum Daily Chart: DeMark Indicator
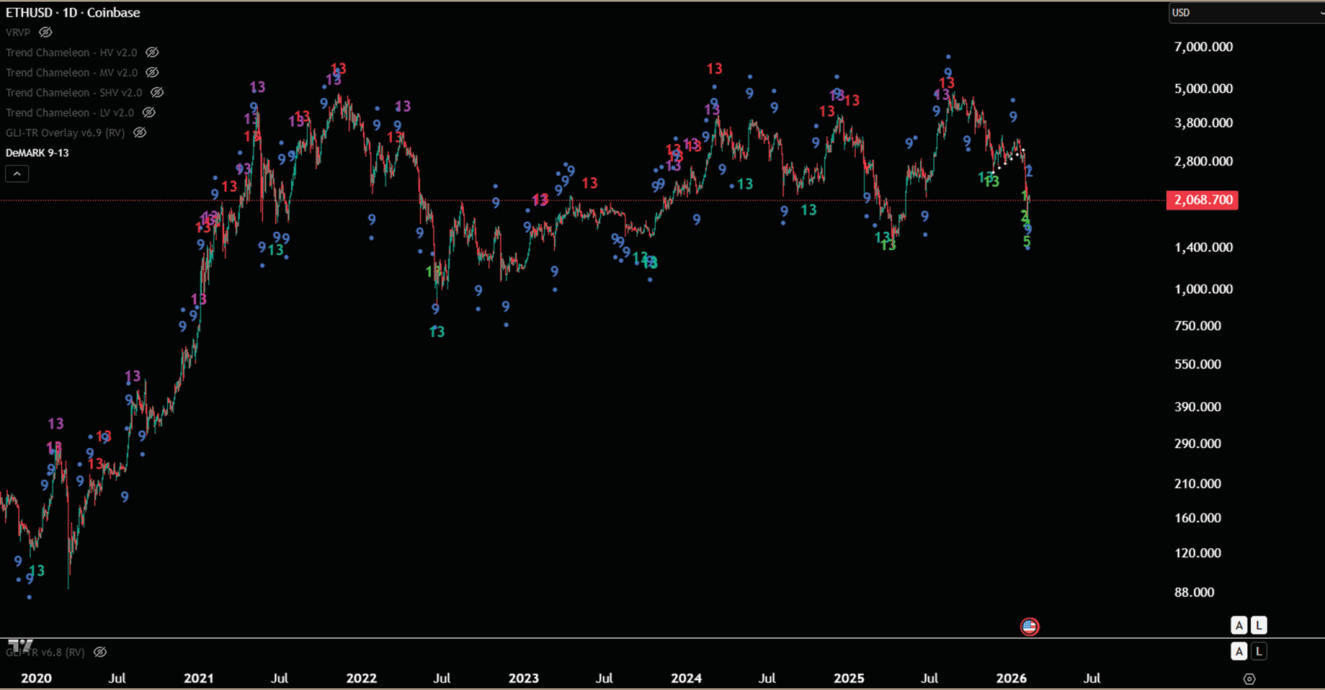
Ethereum Weekly Chart: DeMark & Chameleon Trend Indicators
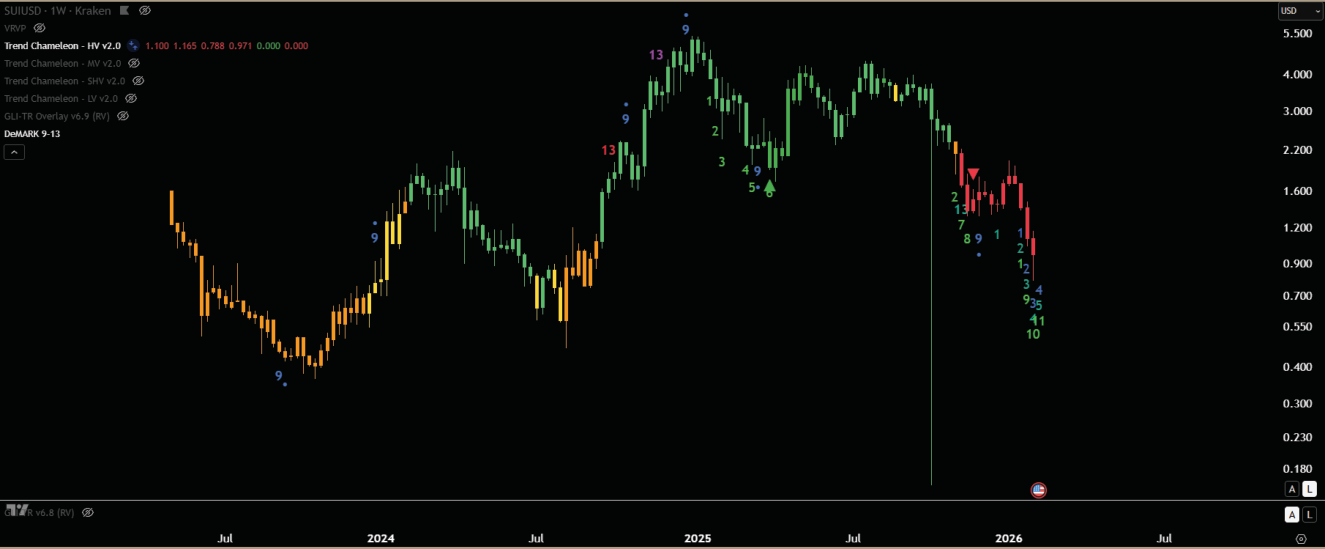
Sui has printed a daily TD 13, but I am waiting for weekly confirmation. The weekly count is more advanced than ETH, so we may have that signal within two weeks.
Sui Weekly Chart: DeMark & Chameleon Trend Indicators
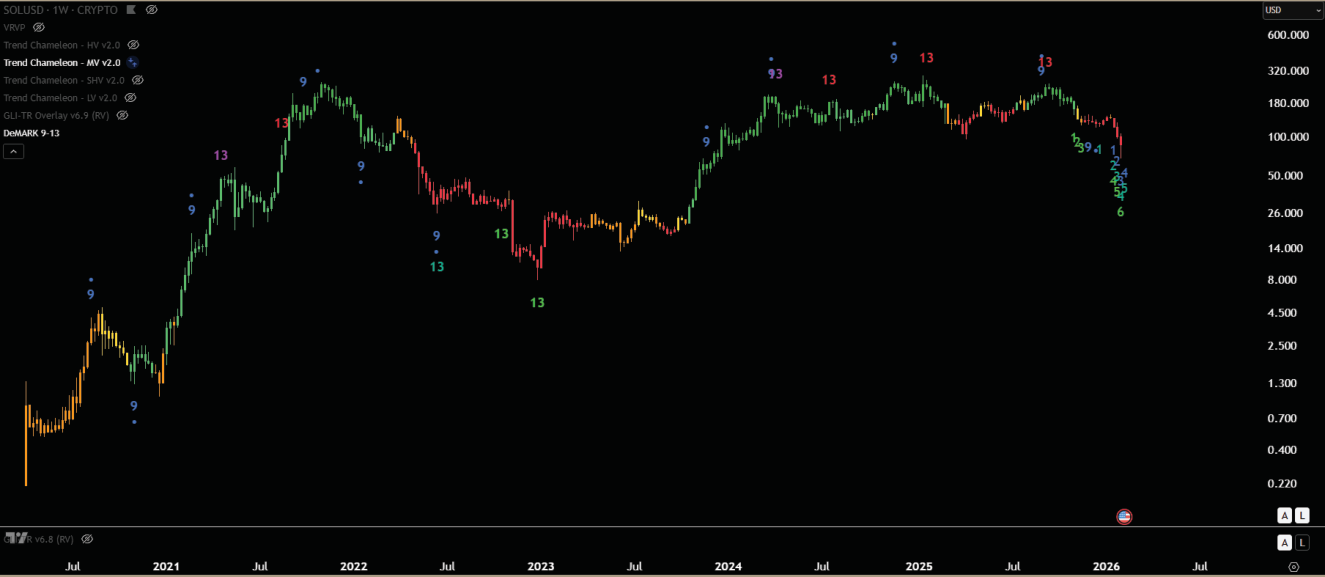
Solana shows a similar setup: daily exhaustion reached, weekly count, progressing but not yet confirmed.
Source PDF · page 24Solana Weekly Chart: DeMark & Chameleon Trend Indicators
With the technical picture mapped out, the question becomes how to position.
Positioning: Patient, Selective
The weight of evidence points to a short-term bottom being very close. The DRS at 1, weekly RSI below 30 for the fourth time in thirteen years, breadth at 2022 capitulation levels, and a 3.5 sigma drawdown all point in the same direction. These signals have a track record over short forward windows and a reasonable one over medium to long term.
But a short-term low is not a cycle low. Realised Cap has started rolling over. ETH has not yet registered daily DeMark exhaustion, let alone weekly. The structural damage needs time to repair.
My base case is that we are in the early stages of a multi-month bottoming process that extends into Q2, possibly Q3, before a durable low is established. History supports this. Previous bear markets have taken around 12 months from the peak to the final low. The dry brush has burned, but the ground is still hot.
There is a scenario where this extends further. A downturn in the liquidity cycle is slated for late 2026 into 2027. If the bottoming process drags into the second half of this year, it risks colliding with deteriorating liquidity conditions rather than improving ones. That would turn a cyclical bear market into a prolonged one. It’s also why I am inclined to feel things might evolve more from here.
Source PDF · page 25What I Am Doing
I remain focused on the large-cap assets: BTC, ETH, and SOL, and potentially other SCPs in the coming weeks/months, looking to accumulate at levels reached in previous bear markets. I will continue to scour for the potential up-and-comers for the next cycle.
Key Support Levels
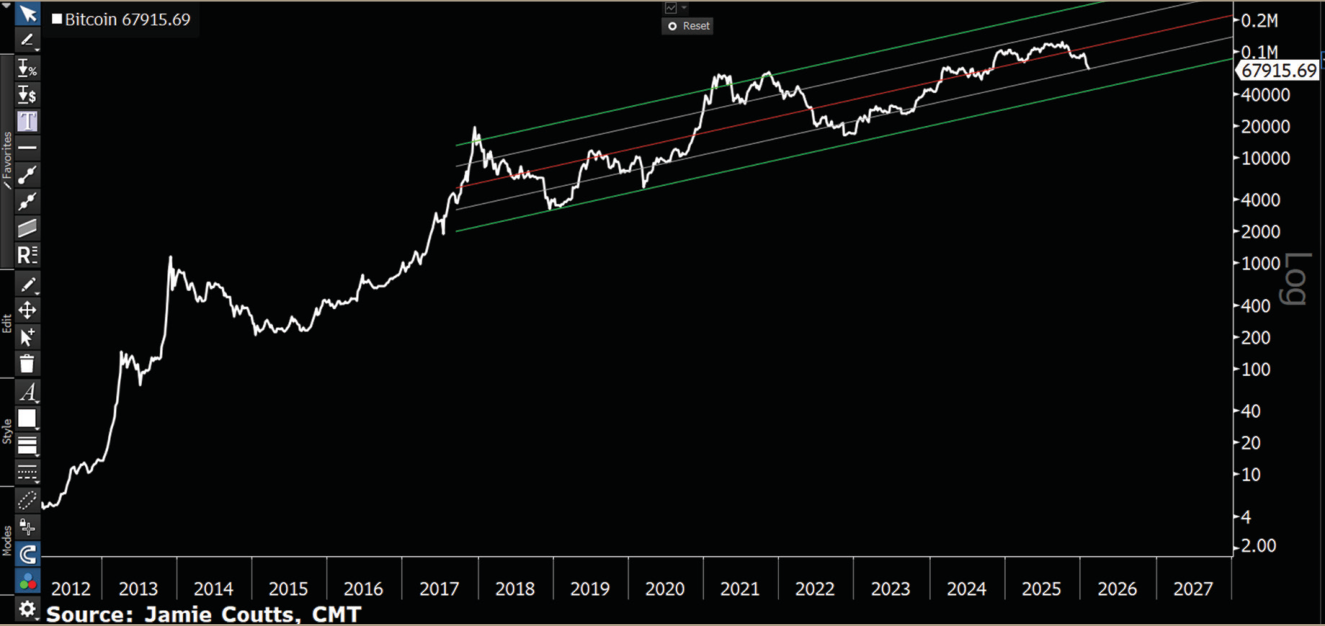
With Bitcoin hovering above $69,000 and the majority of recent buyers underwater, further downside into the mid-to-low $50,000 range cannot be ruled out. The 200-week moving average, currently at $58,000, has acted as a magnet in every prior bear market. Below that, the -2 standard deviation band on the regression model measured from the 2017 cycle suggests a floor in the low $50,000 range.
These levels represent deep value for Bitcoin, and where I would shift from patient to aggressive, scaling positions with trend reversals on the daily and weekly timeframes.
200-Week Simple Moving Average
Bitcoin Regression (Measured from 2017 vs. 2013 Cycle)
What Changes My Mind
More bullish: A weekly DeMark 13 on BTC printing while price holds above the 200-week SMA would be the strongest confirmation that the cycle low is in. Trend Chameleon reversals on the daily and weekly charts would add further conviction. A sustained reversal in Realised Cap, indicating fresh capital entering, would warrant accelerating accumulation.
More bearish: A decisive break below the 200-week SMA on volume with no DeMark exhaustion signal would indicate the bear market has further to run. Deteriorating liquidity conditions arriving ahead of schedule, or a macro shock that tightens financial conditions materially, would extend the timeline and likely push price into much lower support zones.
Markets rarely follow anyone’s base case or act in a linear fashion. I will update these views as the indicators move and will not hesitate to shift positioning if the data warrants it.
The next report will likely cover an update on the liquidity framework and the smart contract platform valuation analysis. The dry brush is clearing, but there are still risks ahead. The next step is mapping the liquidity picture, where value sits across the sector, identifying some new protocols to add to the watchlists while watching for the signs of a major trend reversal.
Source PDF · page 27Jamie Coutts, CMT
A passionate advocate for personal health, wellness and liberty, Jamie is committed to amplifying solutions that promote greater personal autonomy, economic freedom and decentralization.

A pioneer in crypto financial analysis and a sought-after speaker, Jamie has transitioned from traditional markets to digital assets, creating research insights for institutions assessing blockchains and digital assets as part of their strategic investment allocations. Jamie’s multi-disciplinary approach blends traditional macro, technical, and quantitative techniques with the emerging field of crypto fundamentals.
Jamie’s career started as a stockbroker in Australia before roles as an equity trader at a global macro hedge fund and equity sales in Singapore and London. In 2014, Jamie joined Bloomberg Singapore as the senior Asia Buyside equity specialist, where he later led the regional crypto/digital assets sales and product strategy before launching Bloomberg Intelligence’s crypto asset research product.
Jamie holds a business degree and two technical analysis designations, previously serving on the global board of the Chartered Markets Technician (CMT) Association, where he was also head of APAC Development. Jamie has spoken at conferences across Asia and the U.S., and his research regularly features on crypto podcasts. His content is available via the Bloomberg terminal, as well as Twitter and LinkedIn.